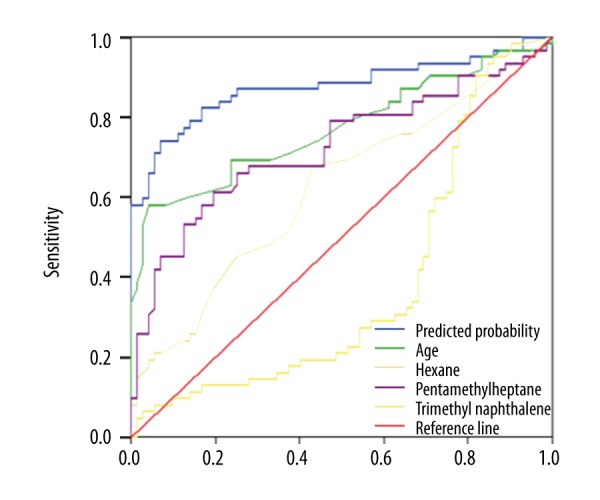
Figure 5.

ROC curves of predicted probability and diagnostic values of significant variables. The AUC of the LR model was 0.878, which was higher than AUCs for age (0.774), hexane (0.622), 2.2.4.6.6-pentamethyl heptane (0.726), and 1.2.6-trimethyl naphthalene (0.381).
