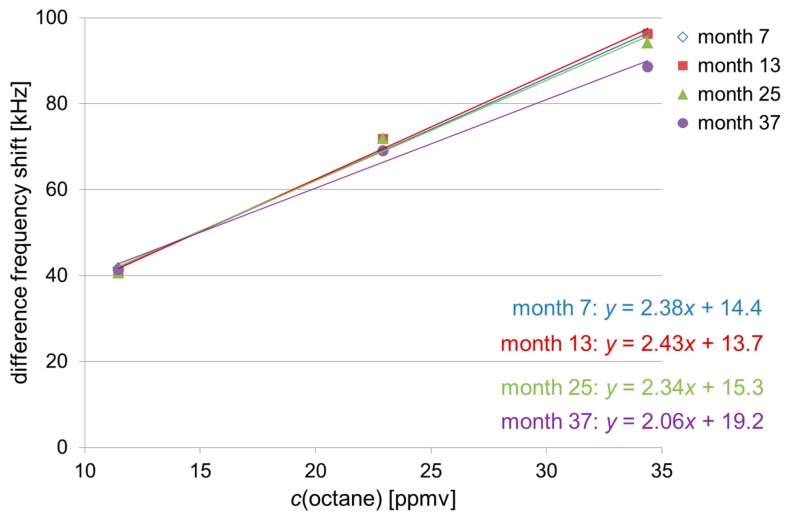
Figure 6.
Mean values of sensor 1 (PBMA coating) obtained with octane samples at the concentrations of 11.5 ppmv, 22.9 ppmv, and 34.4 ppmv at (semi-)annual intervals: As month 1 is missing, year 1 is represented by month 7. The lowest and highest concentrations were measured in triplicate, the medium concentration in duplicate. For the sake of clarity, error bars are not included. Regression lines were calculated with y = difference frequency shift [kHz] and x = c(octane) [ppmv].

