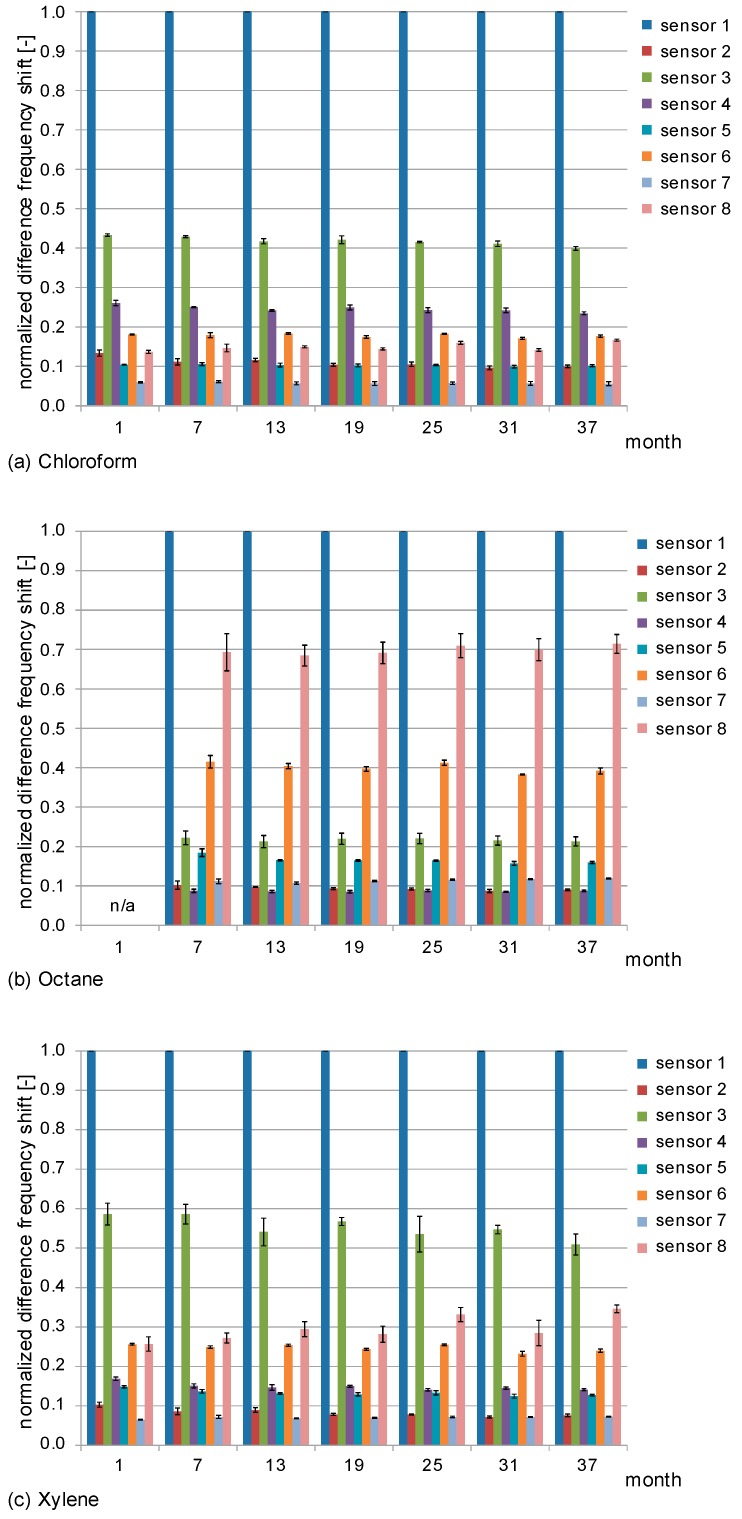
Figure 8.
Normalized difference frequency shifts obtained with the STW sensor array. Samples were (a) chloroform; (b) octane and (c) xylene. One representative measurement was chosen from each of the three solvent vapor concentrations; and the difference frequency shifts of all sensors were normalized to the corresponding difference frequency shift of sensor 1 (i.e., the maximum difference frequency shift). Columns represent the means; error bars represent the standard deviations of the measurements (n = 3).

