Figure 2.

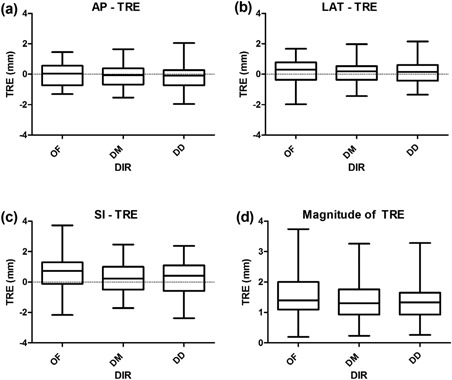
Box plot graphical representation of the ANOVA results for: (a) AP, (b) LAT, (c) SI, and (d) magnitude TRE for the OF, DM, and DD DIR.

Box plot graphical representation of the ANOVA results for: (a) AP, (b) LAT, (c) SI, and (d) magnitude TRE for the OF, DM, and DD DIR.