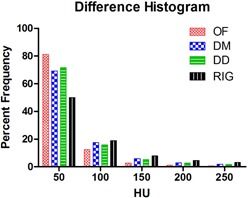
Figure 8.

Histogram of the differences between the deformed and the target images. The histogram shows the differences in HU between the images as a percentage of the total number of voxels encompassed by the region of interest. The RIG shows the HU difference between the moving and the target images.
