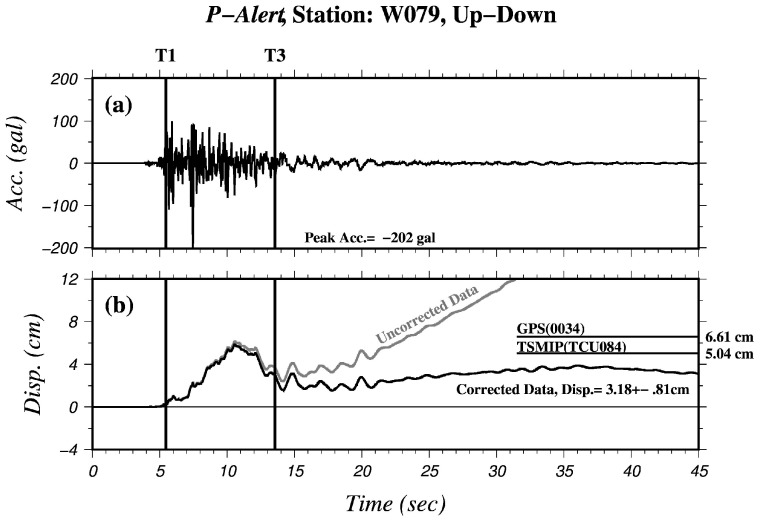
Figure 3.
Vertical component time series of (a) accelerogram and (b) uncorrected (grey) and corrected (black) displacements recorded at P-Alert station W079 for the 2 June 2013 earthquake. Two horizontal lines depict the Cd results of the GPS and the TSMIP. Vertical lines mark time points of T1 and T3 for baseline correction.

