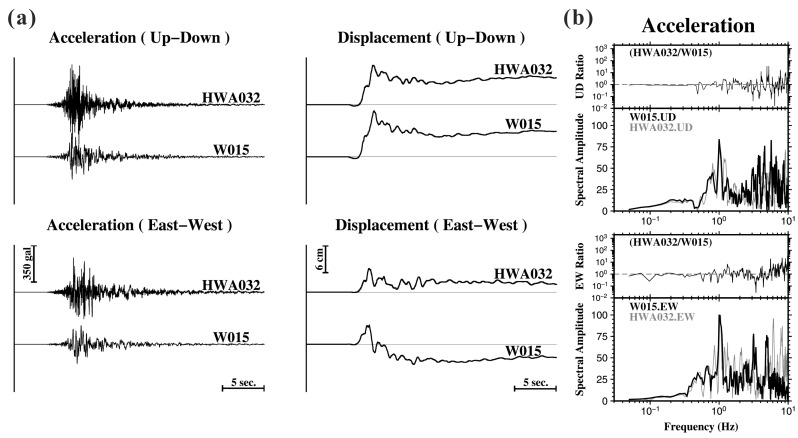
Figure 5.
(a) Comparison of accelerograms (left) and corrected displacements (right) in the vertical and horizontal (East-West) components recorded at the TSMIP (HWA032) and P-Alert (W015) stations. (b) Fourier spectral amplitude of acceleration records and amplitude ratio between the W015 and HWA032 stations for the vertical (upper) and East-West (bottom) components. A dashed line is shown to indicate a ratio value of 1.

