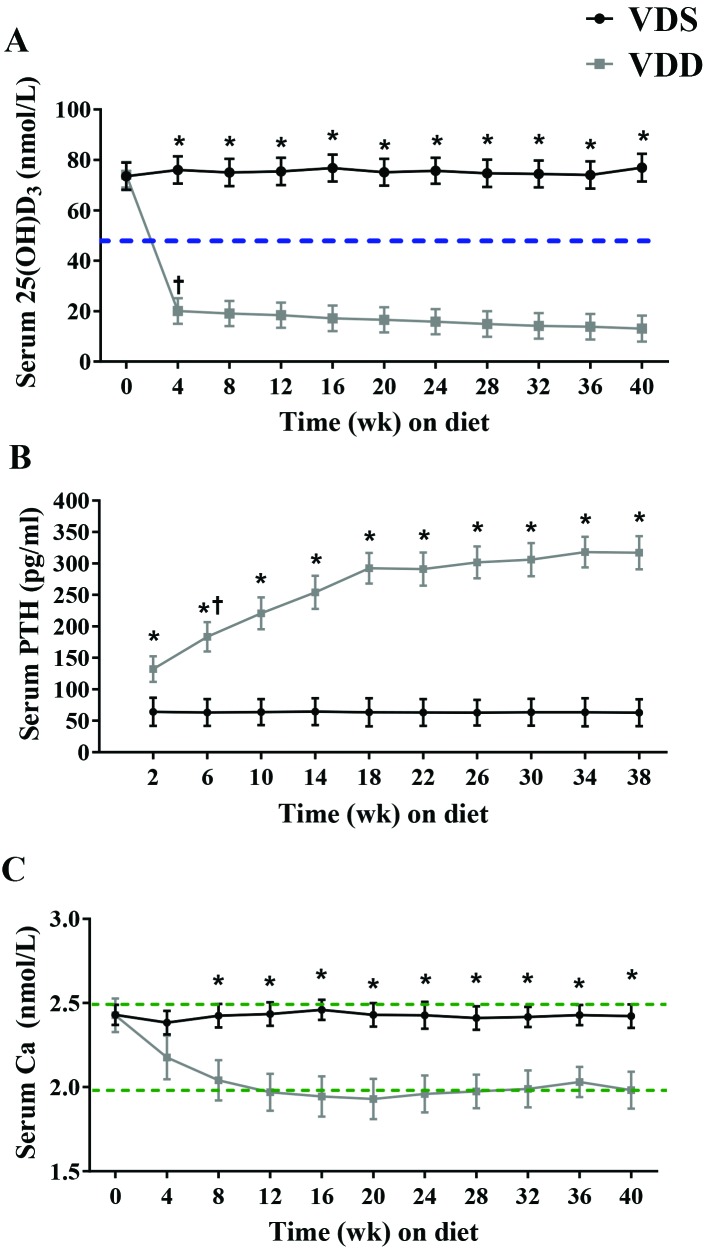
Figure 4.
Circulating concentrations of (A) 25(OH)D, (B) PTH, and (C) calcium. Female C57BL/6 mice were maintained on a vitamin D-sufficient (VDS; n = 7) or vitamin D-deficient (VDD; n = 6) diet for 40 wk. Dashed line in panel A indicates the cut-off value for VDD in humans. Dotted lines in panel C indicate hypo- and hypercalcemia thresholds. Data are presented as mean ± SEM. *, Significant (P < 0.05) between-group difference at the indicated time point; †, significant (P < 0.05) within-group difference from previous time point.

