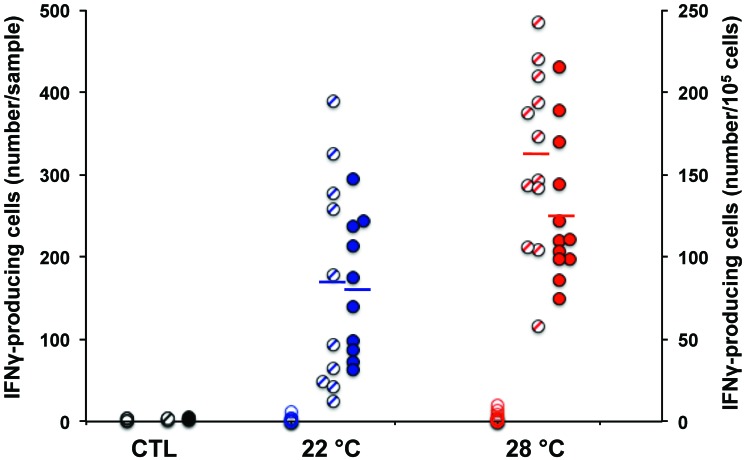
Figure 4.
Ft-specific T cell enumeration. T cell response to LVS was measured in vitro at 3.4 wk after immunization of mice with Ft LVS. Values are expressed as the number of IFNγ-secreting spots per volume blood (hatched circles, left axis) or per 105 viable WBC recovered (filled circles, right axis). Open circles are IFNγ-secreting spots in the absence of Ft antigen addition in vitro. CTL mice were unimmunized. Lines indicate the mean number of responding T cells in each group. Mice maintained at 28 °C had more antigen-specific T cells than mice maintained at 22 °C (P < 0.02 per 105 cells and P < 0.008 per sample).

