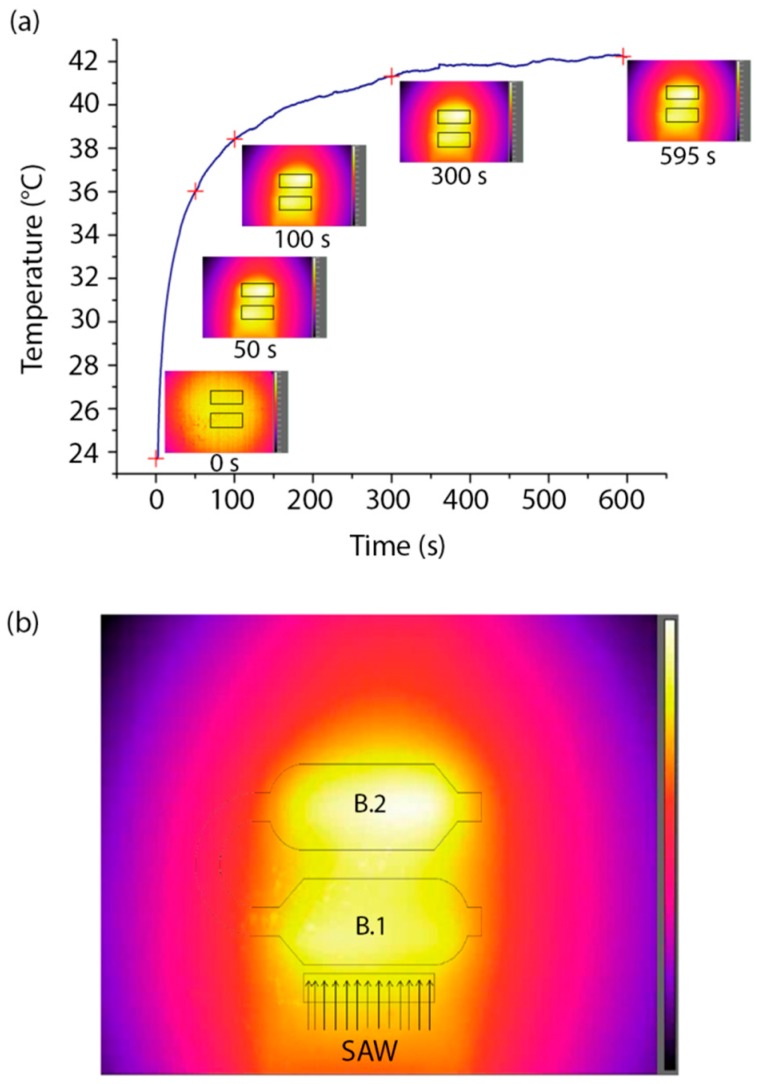
Figure 6.
Thermal measurements in the presence of SAWs. (a) Heating of the LN substrate versus time (SAW activation at t = 0). The insets show five images from the thermal camera at t = 0 s, 50 s, 100 s, 300 s and 595 s, with the regions of interest (ROIs) used for calculating the average substrate temperature. (b) Temperature profile of the LN substrate at thermal equilibrium after SAW generation. A schematic of the microchannel is superimposed to the image. SAW direction from IDT is specified by the arrows. Color bar ranges from 28.8 °C to 42.0 °C.

