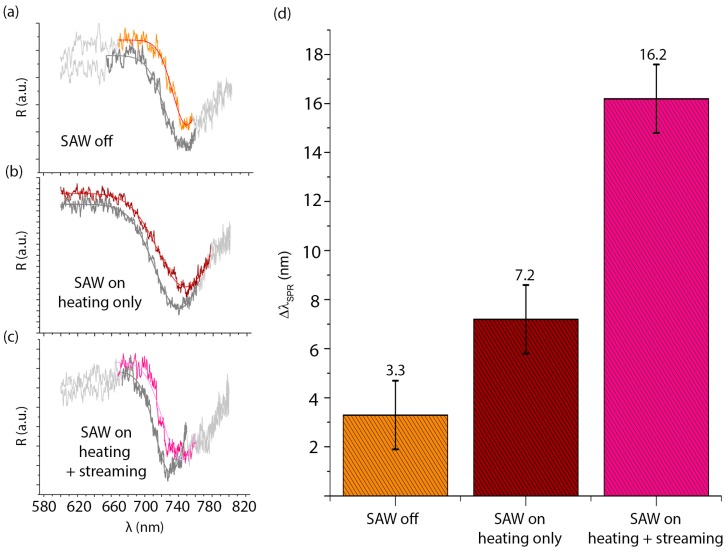
Figure 7.
Representative SPR spectra in the case of water-ethanol (10:1 v/v; dark grey curves), and b-SH in water-ethanol (1 mg/mL) in the microchannel when SAWs are off (orange curve in (a), in the microchamber B.2; bordeaux curve in (b) where only the heating effect of the SAW is present; and magenta curve in (c) where both heating and streaming induced by the SAWs are present. (d) Average resonance wavelength shift in the case of b-SH in water-ethanol (1 mg/mL) to water-ethanol only without the SAW, with the heating effect only of the SAW and with the SAW, respectively.

