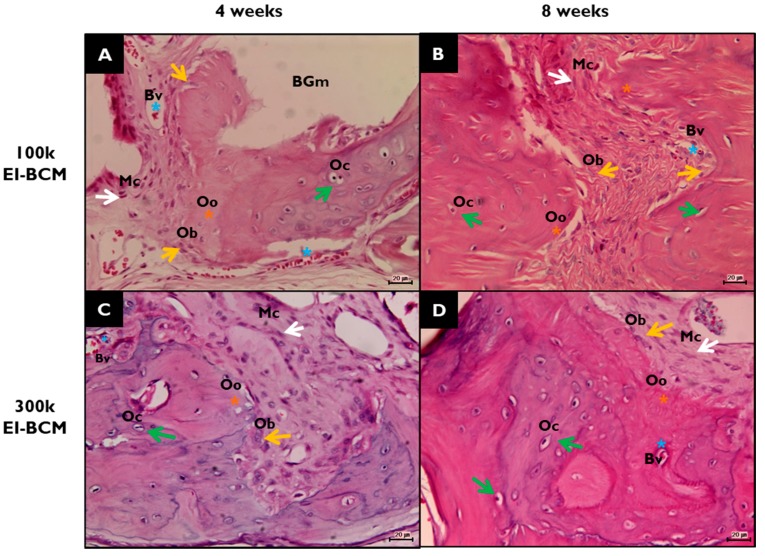
Figure 10.
Histological view of new bone areas (NBAs) in H&E stained defect sites. (A) 100k EI-BCM group at 4 weeks after surgery; (B) 100k EI-BCM group at 8 weeks; (C) 300k EI-BCM group at 4 weeks; (D) 300k EI-BCM group at 8 weeks; NB, new bone; BGm, remaining graft materials; white arrow, mesenchymal cell (Mc); blue asterisk, blood vessel (Bv); yellow asterisk, osteoid (Oo); yellow arrow, osteoblast (Ob); green arrow, osteocyte (Oc) within lacuna (Original magnifications: 100×).

