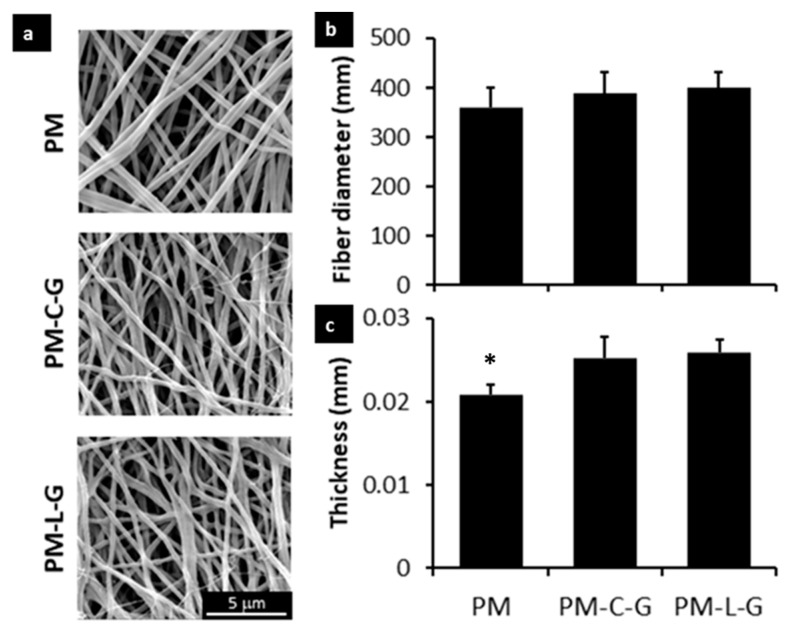
Figure 2.
Scanning electron micrographs of (a) PM, PM-C-G, and PM-L-G. Bar graphs illustrate the (b) average fiber diameter and (c) thickness of the PM nanofibers. The coated PM fibers had a rougher surface compared to non-coated PMMA. This confirmed that collagen and laminin had been successfully applied as coatings on the surface. However, there was not a significant difference in fiber diameter (n = 90 per fiber type). * indicates significantly lower thickness of PM scaffolds compared to PM-C-G and PM-L-G scaffolds.

