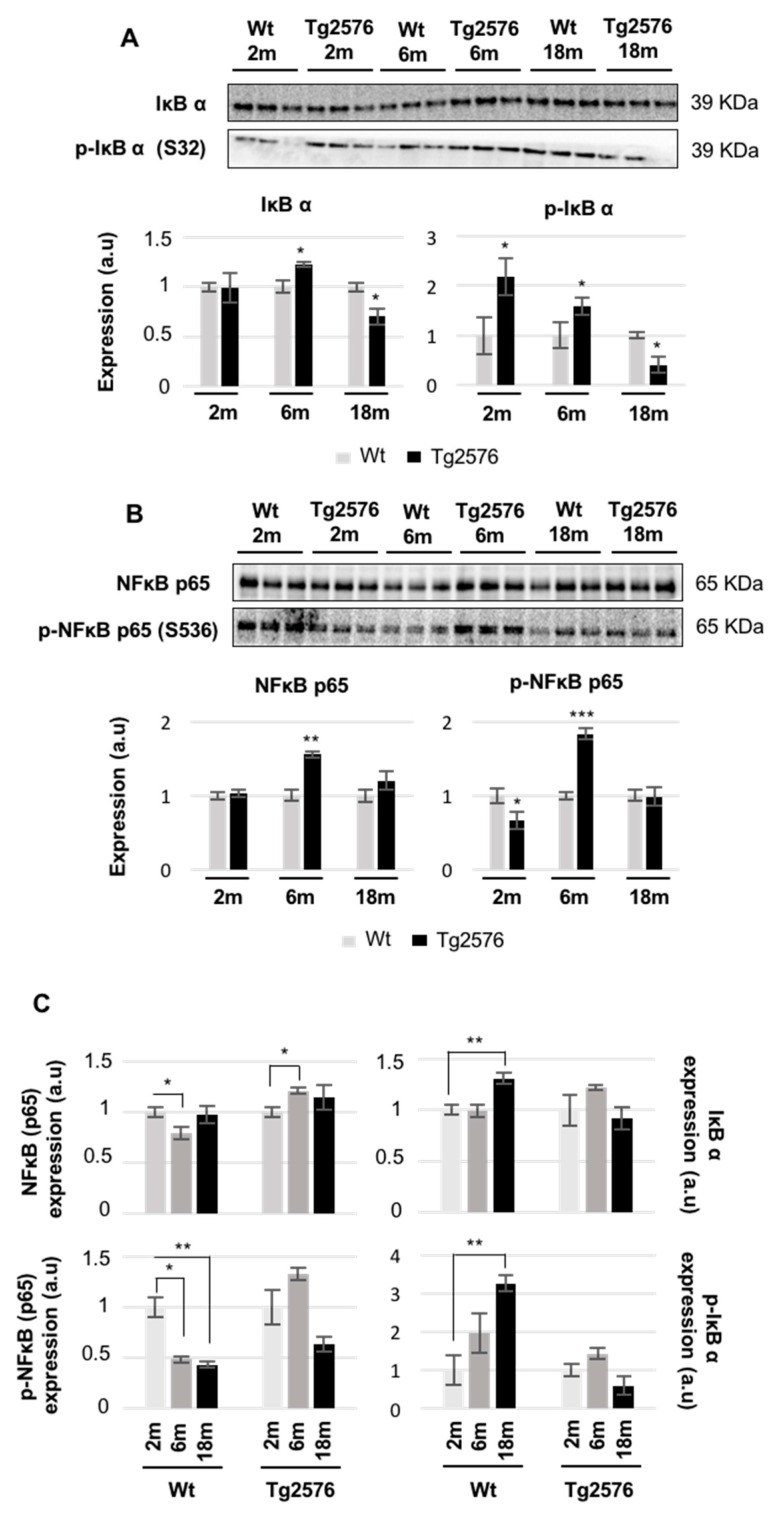
Figure 7.
Time-dependent functionality of the OB IκBα-NFκB p65 complex in Tg2576 mice. Levels and residue-specific phosphorylation of the IκBα (A); levels and residue-specific phosphorylation of NFκB p65 subunit (B); Equal loading of the gels was assessed by stain-free digitalization. Panels show histograms of band densities. Data are presented as mean ± SEM from three independent OB samples per group. * p < 0.05 vs. control group; ** p < 0.01 vs. control group; *** p < 0.001 vs. control group. The expression of the IκBα-NFκB p65 complex was also evaluated during the aging process in WT and Tg2576 mice. * p < 0.05 vs. 2-month-old mice; ** p < 0.01 vs. 2-month-old mice (C). Equal loading control and quantitation values have been included in Table S5. m, month; a.u., arbitrary units.

