Figure 2.
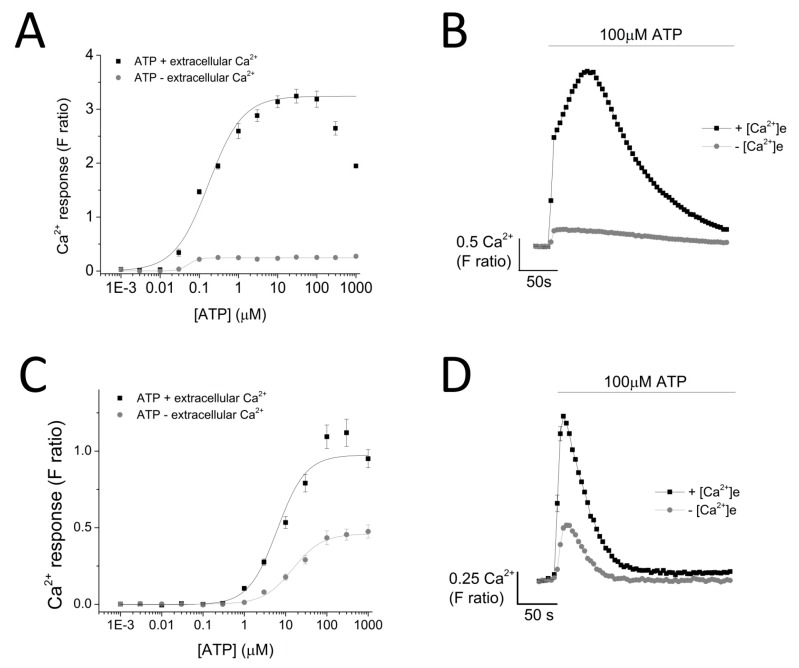
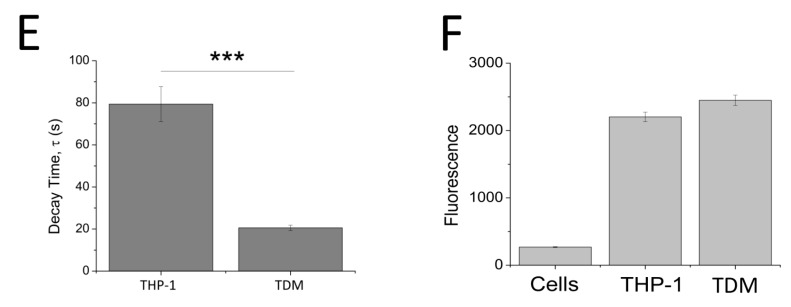
ATP-evoked intracellular Ca2+ responses in THP-1 monocytes and THP-1 differentiated macrophages. Concentration response curve of ATP (0.01–1000 μM) in the presence and absence of extracellular Ca2+ and its representative traces at 100 μM ATP in: (A,B) THP-1 cells (n = 3) and (C,D) THP-1 differentiated macrophages (n = 3); (C) bar chart representing decay kinetics of THP-1 cells (n = 12) and THP-1 differentiated macrophages (n = 6); (D,E) difference in decay time of 100 μM-evoked Ca2+ response in THP-1 versus TDM cells. Tau (τ) is the time constant calculated from fitting a single exponential decay to the falling phase of Ca2+ response (n = 5); (F) cell quantification assay using nuclear stain H-33342. Asterisks include significant changes towards control (*** p < 0.001, n = 4). TDM: THP-1 differentiated macrophages.


