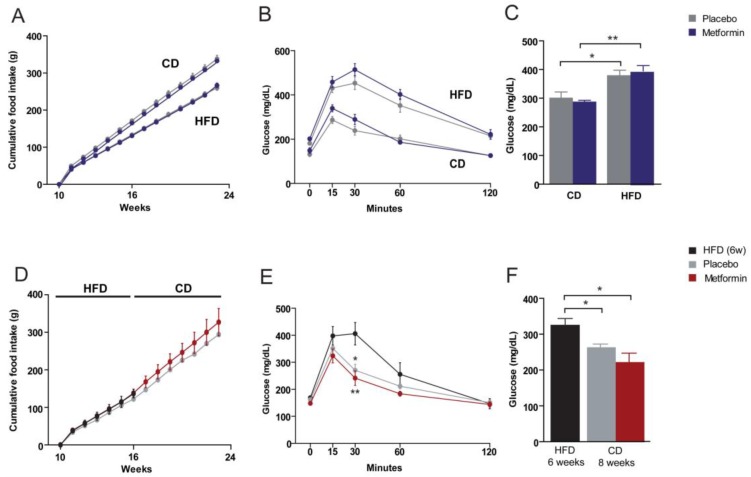
Figure 2.
Dietary-induced changes and the effect of metformin on food intake and glucose homeostasis. (A,D) Cumulative food intake, (B,E) glucose tolerance tests, and (C,F) plasma glucose levels segregated by the type of dietary experiment (A–C) CD versus HFD, and (D–F) diet reversal and use of metformin as indicated by the legends. Asterisks denote significant (* p < 0.05; ** p < 0.01) changes.

