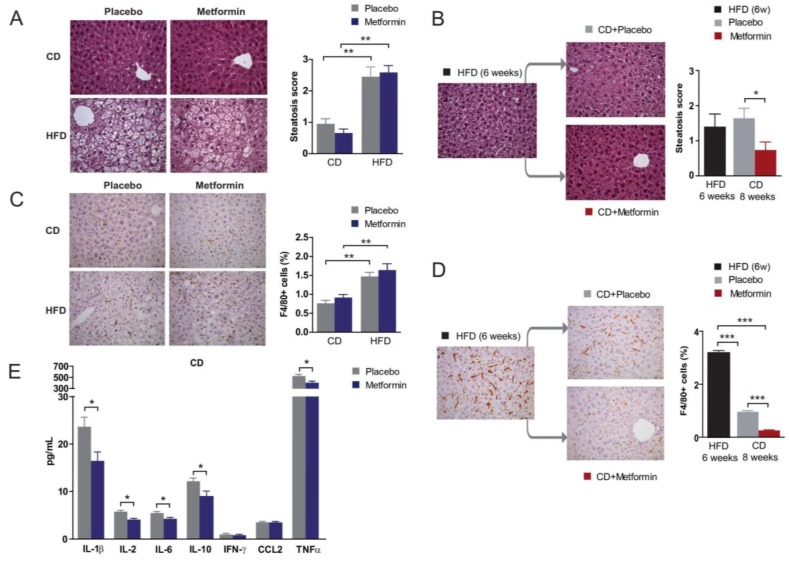
Figure 5.
Dietary-induced changes and the effect of metformin on the liver phenotype. Effects of diet and metformin at indicated times during nutritional variations. Representative microphotographs (100×) of liver sections stained with H&E (A,B) and F4/80 immunochemistry (C,D) showing the effects of diet and metformin in steatosis score and proportion of macrophages; (E) the effect of metformin in the hepatic concentration of selected cytokines in CD-fed mice. Legends as in Figure 1 and asterisks denote significant (* p < 0.05; ** p < 0.01; *** p < 0.001) changes as indicated.

