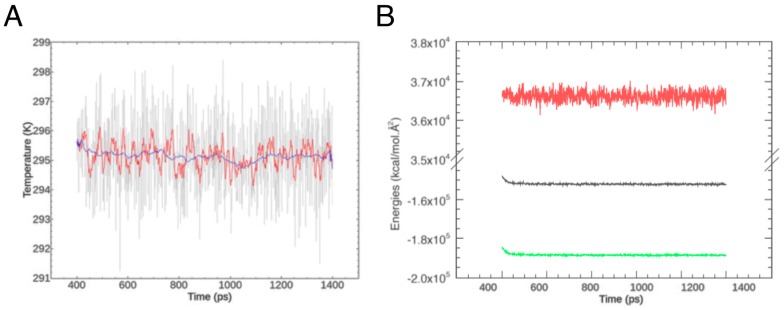
Figure 2.
Equilibration of the PIN2 loop. (A) Behavior of system temperature over the equilibration period. The full raw data are in grey, while the red and blue lines show window averages over 10 and 100 ps, respectively; (B) Potential energy (green), kinetic energy (red) and total energy (black) of the system over the same period.

