Figure 7.
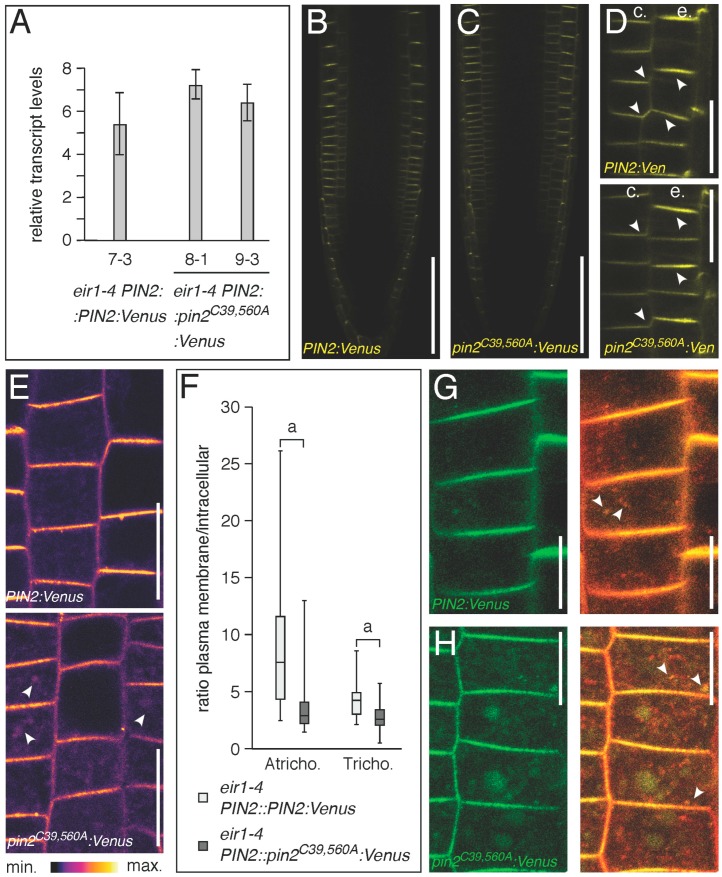
Expression pattern and localization of PIN2::pin2C39,560A:Venus reporter lines. (A) Relative transcript levels of PIN2::PIN2:Venus and two PIN2::pin2C39,560AVenus lines at 6 DAG. Two biological repetitions have been used for each sample, with transcripts normalized to expression of EF1a (At1g07940). Bars indicate standard deviations. One-way ANOVA with post-hoc Tukey HSD test demonstrated no significant differences in transcript levels (PIN2::PIN2:Venus vs. PIN2::pin2C39,560AVenus 8-1, p = 0.1506725; PIN2::PIN2:Venus vs. PIN2::pin2C39,560AVenus 9-3, p = 0.5558223); (B,C) Expression pattern (yellow coloration) in: eir1-4 PIN2::PIN2:Venus (B) and eir1-4 PIN2::pin2C39,560AVenus (C) primary root meristems at 6 DAG is restricted to lateral root cap, epidermis and cortex cells; (D) Reporter signal localization in epidermis (“e”) and cortical (“c”) in eir1-4 PIN2::PIN2:Venus and eir1-4 PIN2::pin2C39,560AVenus primary root meristem cells at 6 DAG. Arrowheads indicate polar localization of the reporter signals; (E) Comparison of signal distribution in eir1-4 PIN2::PIN2:Venus and eir1-4 PIN2::pin2C39,560AVenus primary root meristem epidermis cells at 6 DAG; white arrowheads indicate intracellular reporter protein signals; (F) Signal quantification in eir1-4 PIN2::PIN2:Venus and eir1-4 PIN2::pin2C39,560AVenus primary root meristem epidermis cells at 6 DAG. The ratio of reporter signal intensities at the plasma membrane compared to intracellular signals was determined in 36–57 trichoblast (“Tricho.”) and atrichoblast (“Atricho.”) cells for each sample. Two-tailed t-test analysis of resulting values demonstrated significant differences (p < 0.001, “a”); (G,H) Staining of eir1-4 PIN2::PIN2:Venus and eir1-4 PIN2::pin2C39,560AVenus (green) with FM4-64 for 30 min in the dark, followed by visualization at the CLSM. White arrowheads indicate co-staining (yellow) in endocytosed compartments. Size bars: B–D = 50 μm; E = 20 μm; G,H = 10 μm.

