Figure 8.
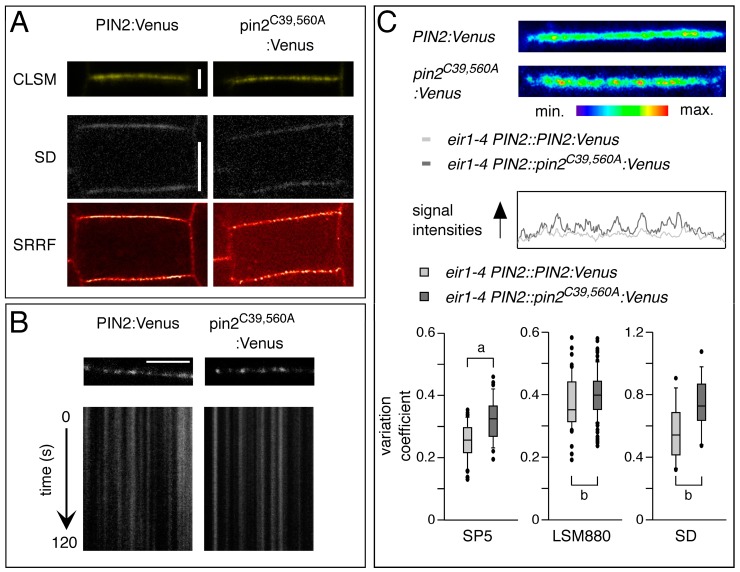
Distribution and mobility of PIN2-Venus reporter proteins. (A) Upper row: Comparison of PIN2:Venus (left) and pin2C39,560A:Venus (right) signals at the plasma membrane of root epidermis cells, viewed by conventional CLSM imaging. Middle row: A single frame generated by fast SD scanning (50 ms exposition), displaying PIN2:Venus (left) and pin2C39,560A:Venus (right) signals at the plasma membrane of root epidermis cells. Bottom row: SRRF algorithm applied to 100 frames generated by SD on the same sections as above. Scale bars 2 µm (CLSM) and 5 µm (SD); (B) Kymographs representing the fluorescence of PIN2:Venus (left) and pin2C39,560A:Venus (right) signals over time. Scale bar 5 µm; (C) Top panel: Comparison of signal distribution in root epidermis plasma membrane domains of PIN2:Venus and pin2C39,560A:Venus. Bottom panels: Box plots displaying PIN2:Venus and pin2C39,560A:Venus signal intensity profiles at the plasma membrane calculated from CLSM (Leica SP5, Zeiss LSM880) and SD images. Ninety membranes from images generated by Leica SP5, 150 from Zeiss LSM880 and 40 membranes from SD images were used for these analyses. Two-tailed t-test analysis of resulting values demonstrated significant differences (p < 0.001, “a”; p < 0.05, “b”).

