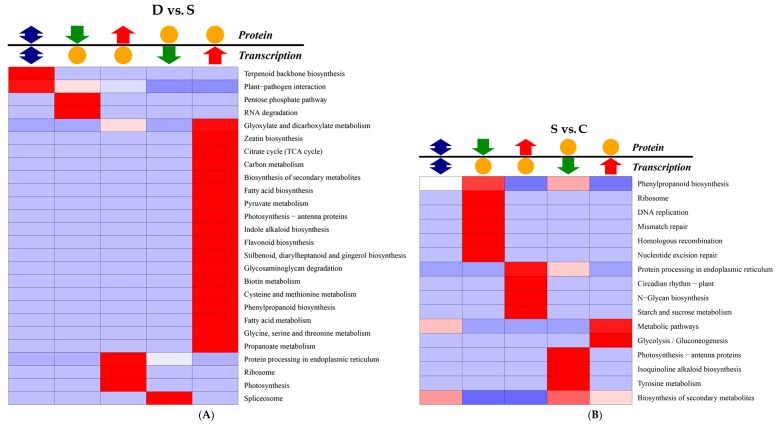
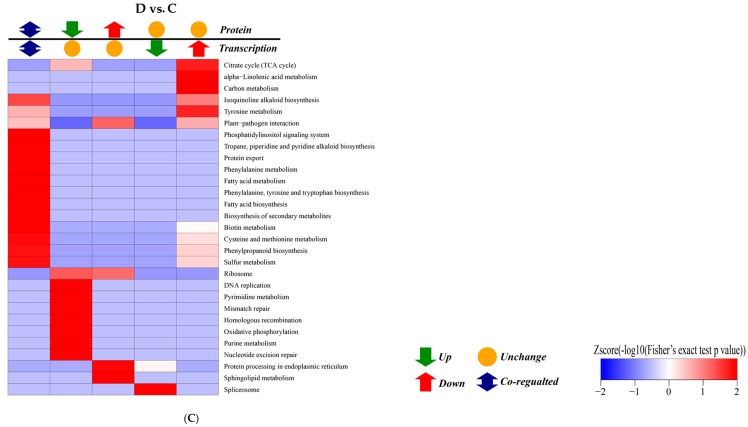
Figure 8.
Enrichment correlation analyses of KEGG pathway in various comparative groups. Note: (A) KEGG pathway between transcription and proteomics in the D vs. S group; (B) KEGG pathway in the S vs. C group (C) KEGG pathway in the D vs. C group. There were simultaneous changes in both protein and transcription levels. KEGG, Kyoto encyclopaedia of genes and genomes.


