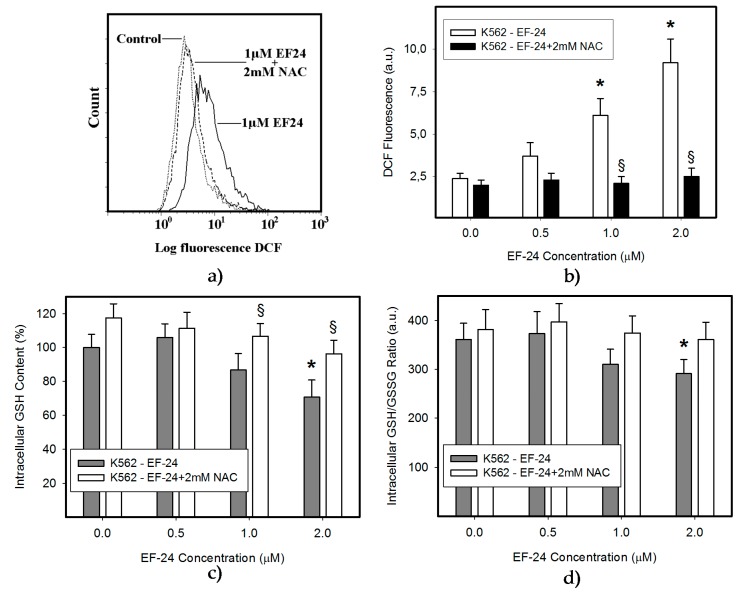
Figure 2.
Effect of NAC on EF-24-induced oxidative stress. Cells were treated with EF-24 or with EF-24 + 2 mM NAC, as indicated. The experimental points represent mean values from three replicate experiments, with standard deviations. (a) Effect of NAC on reactive oxygen species (ROS) production in EF-24-treated cells. ROS production was determined using flow cytometry after 3 h incubation. A representative analysis. (b) A quantitative analysis of the effect of NAC on ROS production in response to EF-24 treatment. ROS production was determined using flow cytometry after 3 h incubation; * denotes significant change in ROS production (p < 0.05) between control (untreated) K562 cells and cells treated with EF-24; § denotes significant change in ROS production (p < 0.05) between EF-24 treated K562 cells and cells treated with EF-24 + NAC. (c) Effect of NAC on intracellular glutathione (GSH) level in EF-24 treated cells. After 3 h incubation, the intracellular content of GSH was determined using LC/MS/MS analysis; * denotes significant change in the intracellular level of GSH (p < 0.05) between control (untreated) K562 cells and cells treated with EF-24; § denotes significant change in intracellular level of GSH (p < 0.05) between K562 cells treated with EF-24 and cells treated with EF-24 + NAC. (d) Effect of NAC on GSH/oxidized glutathione (GSSG) ratio in EF-24-treated cells. After 3 h incubation, the intracellular content of GSH and GSSG were determined using LC/MS/MS analysis; * denotes significant change in GSH/GSSG ratio (p < 0.05) between K562 cells treated with EF-24 and cells treated with EF-24 + NAC.

