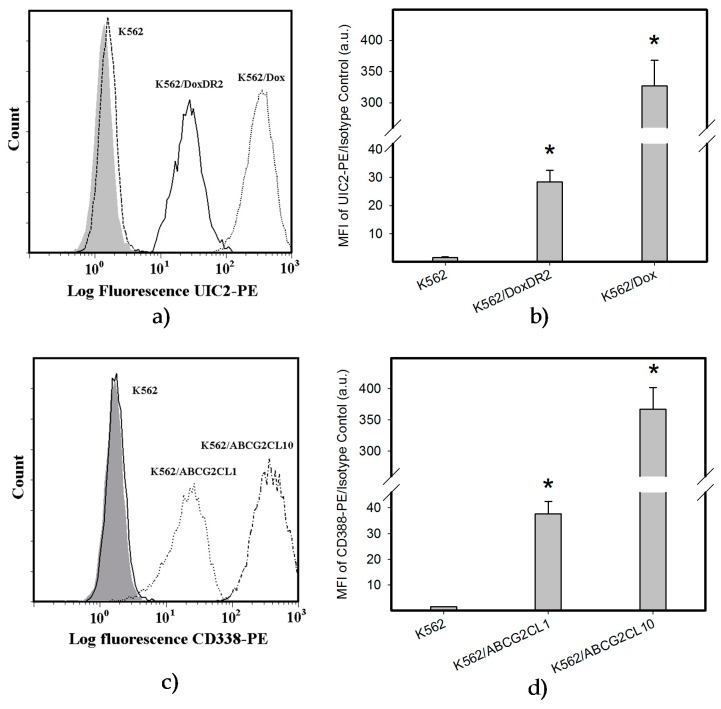
Figure 8.
Analysis of ABCB1 and ABCG2 expression: (a) Flow cytometric analysis of ABCB1 expression. Isotype control (grey histogram); K562 parental cell line (dash line); K562/Dox cells (dot line); K562/DoxDR2 cells (solid line). (b) Quantitative analysis of ABCB1 expression. ABCB1 expression was quantified as the mean fluorescence intensity (MFI) shift (ratio of MFI of UIC2-PE antibody and isotype control). The experimental points represent mean values from three replicate experiments, with standard deviations; * denotes significant change in ABCB1 expression (p < 0.05) between K562 cells and cells expressing various levels of ABCB1 (K562/Dox, K562/DoxDR2). (c) Flow cytometric analysis of ABCG2 expression. Isotype control (grey histogram); K562 parental cell line (solid line); K562/ABCG2CL10 cells (dash-dot line); K562/ABCGCL1 cells (dot line). (d) Quantitative analysis of ABCG2 expression. ABCG2 expression was quantified as the mean fluorescence intensity (MFI) shift (ratio of MFI of CD338-PE antibody and isotype control). The experimental points represent mean values from three replicate experiments, with standard deviations; * denotes significant change in ABCG2 expression (p < 0.05) between K562 cells and cells expressing various levels of ABCG2 (K562/ABCGCL10, K562/ABCGCL1).

