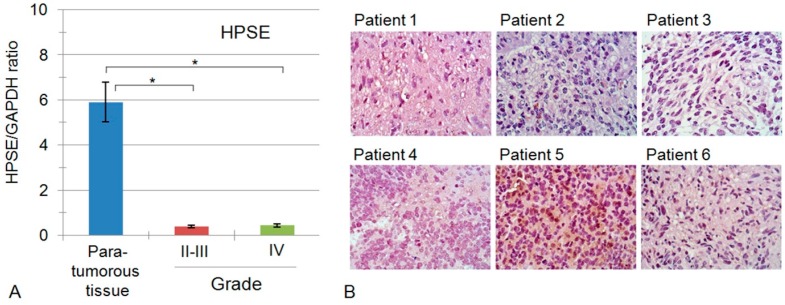
Figure 3.
HPSE expression in the human brain tumours. (A) HPSE mRNA expression levels in tumour samples (real-time RT-PCR). The intensity of the amplified DNA fragments was normalised to that of GAPDH. Bars represent the mean from triplicate experiments ± SD (Origin 8.5; OriginLab Corporation, Northampton, USA); * p < 0.01; (B) Expression and distribution of HPSE protein molecule in glioblastoma tissues. Immunostaining of GBM tumours using anti-HPSE antibodies; counterstaining with Hematoxylin; 1–6 patients; magnification ×400.

