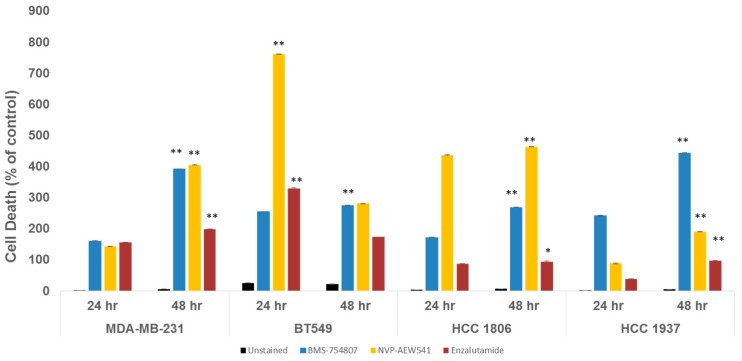
Figure 5.
TNBC cell death is promoted by IGF1R/IR and AR antagonists. Results show % cell death of vehicle-treated controls. An independent control was used for each cell line. TNBC cells were exposed to either BMS-754807 (20 μM), NVP-AEW541 (8 μM) or enzalutamide (20 μM) (n = 3 independent experiments). Error bars represent standard deviation (SD). Data was analyzed by Prism GraphPad software using an unpaired Student t-test. p-Value < 0.05 are considered significant. ** p ≤ 0.005; * p ≤ 0.05.

