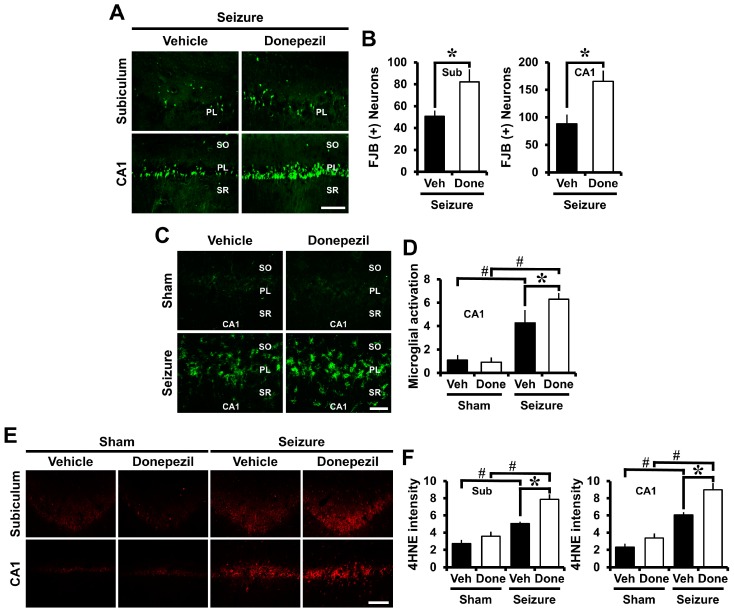
Figure 1.
Pre-treatment of donepezil increased seizure-induced neuronal death, microglia activation and oxidative injury. (A) Representative images show the fluoro-jade B (FJB) (+) neurons in the CA1 and subiculum (Sub) of the hippocampus. The number of degenerating neurons was increased in the donepezil-treated group when compared to the vehicle-treated group. Scale bar = 100 μm; (B) The bar graph shows the number of degenerating neurons; (C) Fluorescent images indicate microglia activation in the CA1 of the hippocampus. In the group treated with donepezil after seizure, microglia activation was increased when compared to seizure vehicle group. Scale bar = 50 μm; (D) The bar graph was obtained by scoring the activation of microglia; (E) Fluorescent images indicate the 4HNE intensity in the CA1 and subiculum of the hippocampus. Oxidative injury increased in the donepezil group when compared to the vehicle group. Scale bar = 100 μm; (F) The bar graph shows the quantified 4HNE intensity. Data are mean ± S.E.M., n = 6 from each sham group. n = 5–7 from each seizure group. * Significantly different from vehicle-treated group. *,# p < 0.05. SO (Stratum Oriense), PL (Pyramidal Layer), SR (Stratum Radiatum).

