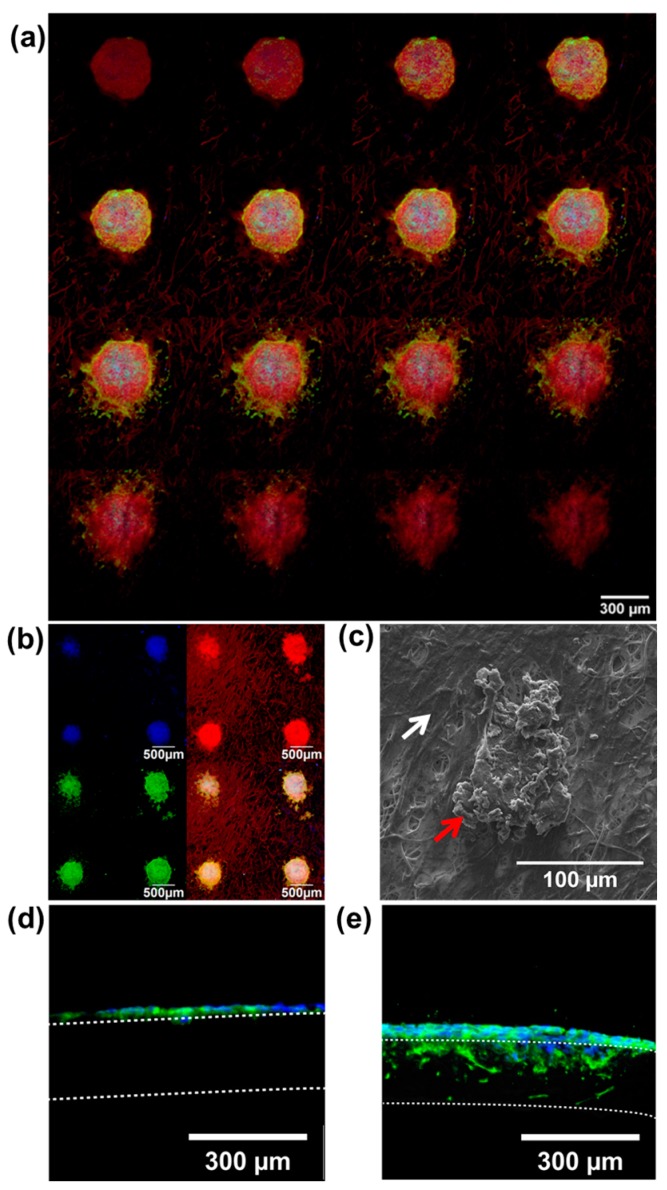
Figure 6.
Three-dimensional shapes of cancer microtissues. (a,b) Confocal microscope images of the cancer microtissues. (a) Confocal stacking image (3 μm step; 16 layers) and (b) patterned cancer microtissue. (a,b) Green indicates HPV18, and red indicates F-actin. (c) SEM image (white arrow: fibroblast, red arrow: cancer tissue). (d,e) Frozen section images, (d) mono-cultured sample, and (e) co-cultured sample. Blue indicates Hoechst 33342 (d,e); only cancer cells are stained. Green indicates F-actin; both fibroblast and cancer cells are stained. All experimental samples were n > 3.

