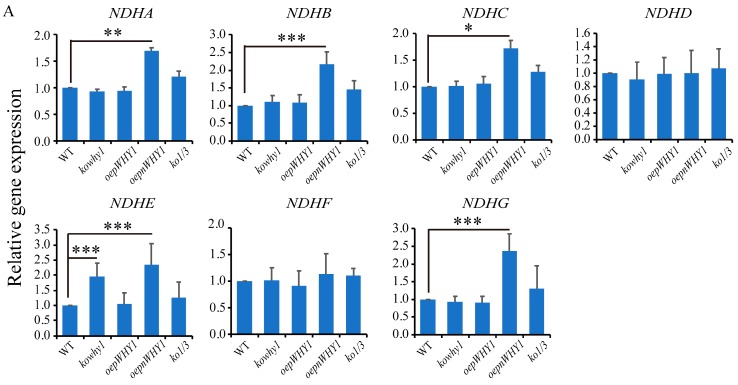
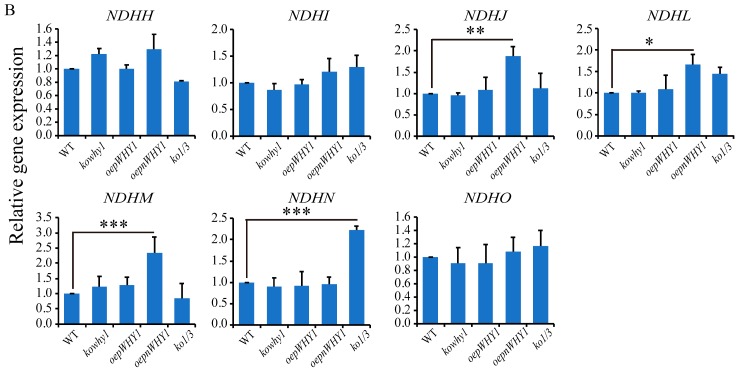
Figure 4.
Expression of NDH-encoded genes in different WHY1 mutants and wild-type plants. (A) Expression analysis of NDH membrane complex encoded genes in WHY1 mutants and wild-type plants by qPCR; (B) Expression analysis of NDH subcomplex-A encoded genes in WHY1 mutants and wild-type plants. The transcript level in each case was normalized to that of GAPC2 as a reference gene, and the expression level of WT was set as 1. Three biological replications were used in the analysis. Asterisk indicate significant differences in gene expression compared to WT (Tukey–Kramer method, * p < 0.05, ** p < 0.01, *** p < 0.001).


