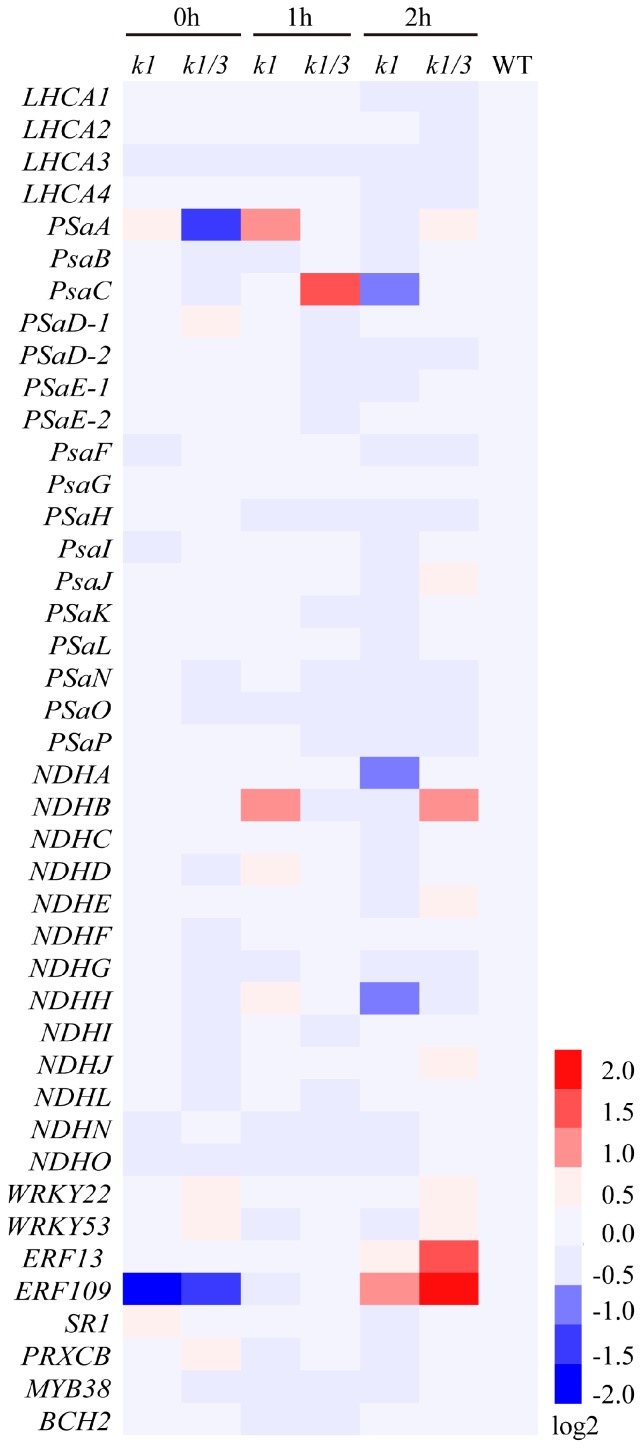
Figure 7.
Heat map of gene expression in kowhy1 and ko1/3 mutants after high light treatment. Gene expression in kowhy1, ko1/3 mutants after high light treatment was analyzed by qPCR. The transcript level in each case was normalized to that of GAPC2 as a reference gene, and the expression level of WT was set as 1. Three biological replications were used to analyze. Heat map were drawn by Heml software used log2 of expression.

