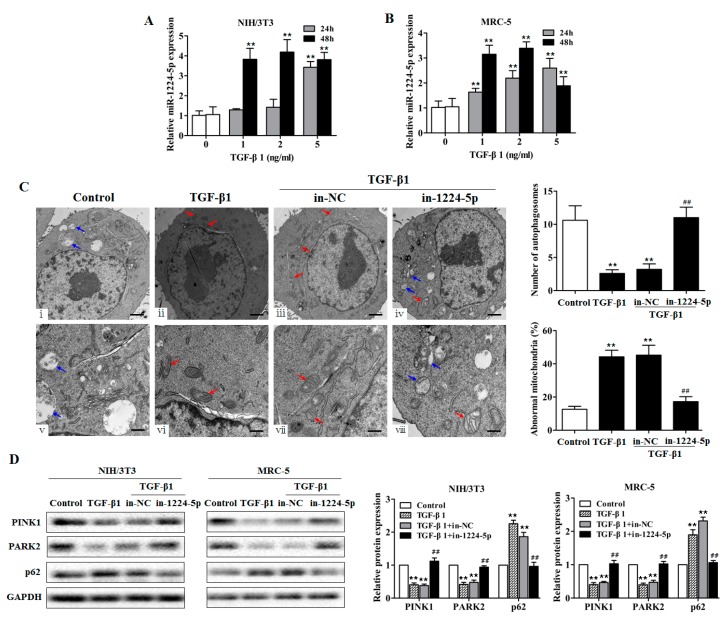
Figure 3.
miR-1224-5p suppresses mitophagy in TGF-β1-exposed fibroblasts. (A,B) qRT-PCR analysis of miR-1224-5p levels in fibroblasts (NIH/3T3 and MRC-5) treated with different dose of TGF-β1 for 24 and 48 h, with ** p < 0.01 vs. the dose 0 group; (C) Transmission electron microscopy detection of mitochondrial structure and vacuoles of fibroblasts (NIH/3T3) transfected with miR-1224-5p inhibitor (in-1224-5p) or its negative control (in-NC) then treated with 2 ng/mL TGF-β1 for 48 h. Blue arrows indicate autophagic vacuoles. Red arrows indicate abnormal mitochondria. Quantification of autophagosomes and percentage of abnormal mitochondria (swollen with an irregular shape and disorganized cristae) from electron microscopy images were performed (five cells each group), with ** p < 0.01 vs. the control group and ## p < 0.01 vs. the TGF-β1 plus in-NC group. Scale bars, 1 µm (upper panels) and 500 nm (lower panels); (D) Western blot and densitometry analysis of the protein expression of PINK1, PARK2, and p62 in fibroblasts (NIH/3T3 and MRC-5) transfected with in-1224-5p or in-NC, with ** p < 0.01 vs. the control group and ## p < 0.01 vs. the TGF-β1 plus in-NC group. All data are expressed as the mean ± SD of at least three independent experiments.

