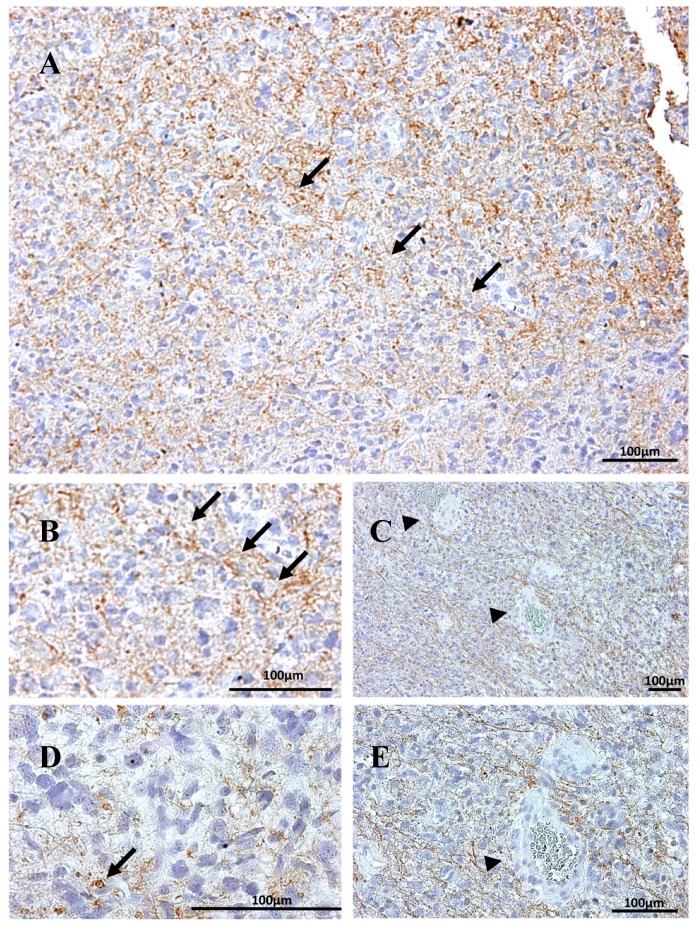
Figure 2.
Immunoperoxidase staining for Na, K-ATPase β1 isoform in secondary GBM. (A) Stronger expression in the edge of the section becoming less intense inwards. Arrows point to the interface between the two zones. (B) Enlargement of the interface line. Na, K-ATPase β1+ cells appear mainly fibrillary (B,C,E), but also as rounded cells (arrow in (D)). (C,E) endothelial cells (arrowheads) are β1− and vessels appear surrounded by β1+ fibers.

