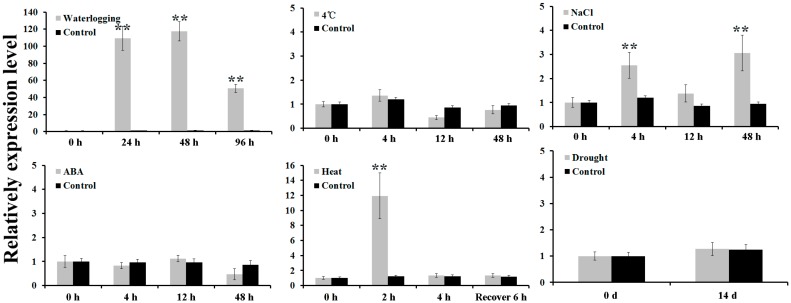
Figure 2.
Expression patterns of AdPDC2 in roots under waterlogging stress and in leaves under NaCl (200 mM), 4 °C, ABA (0.01 mM, Sigma, St. Louis, MO, USA), heat (incubated at 48 °C for 2 h and 4 h, then subsequently at 23 ± 1 °C for another 6 h), drought stresses (watering was withheld 14 d), and corresponding non-treatment plants (control) were assessed using qRT-PCR. AdActin was used as an internal control. Each column is the average of three replicates and each replicate has 15 plants. Bars indicate SD. Double asterisks indicate significant differences compared with non-treatment (0 h) values (** p < 0.01).

