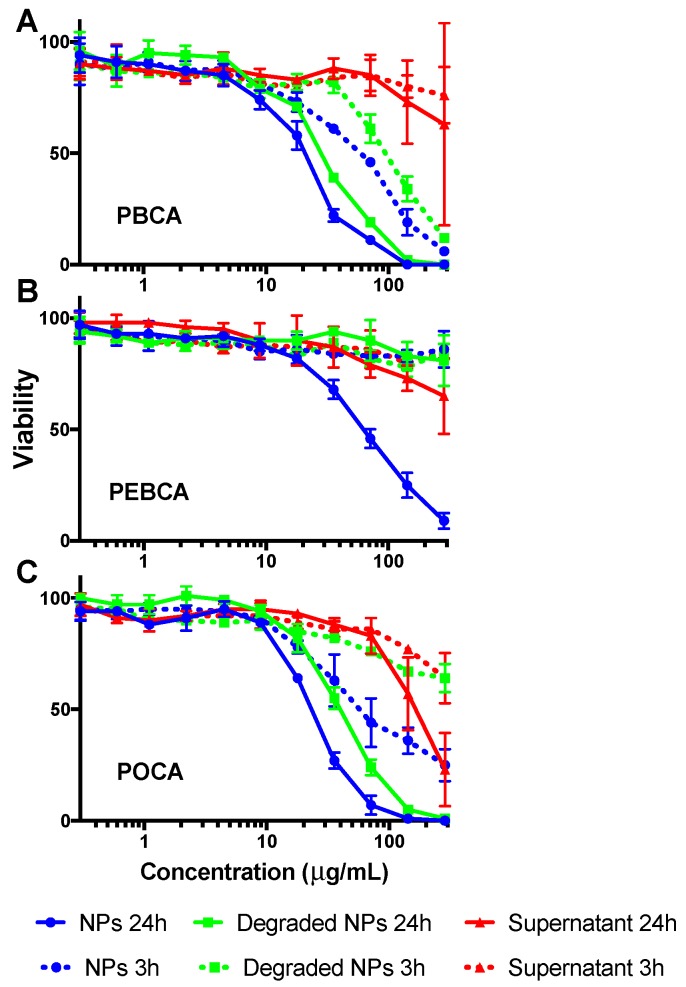
Figure 2.
Toxicity of intact NPs (blue), degraded NPs (green), and supernatant from centrifuged and partly degraded NPs (red) after 3 h (dotted line) and 24 h (continuous line) in Hep G2 cells measured using the CellTiter-Glo® assay. (A–C) show results from PBCA, PEBCA, and POCA NPs, respectively. Each point is the average from two different NPs with the same monomer, but with different PEGylations (short and long PEG, respectively). Error bars show the standard deviation.

