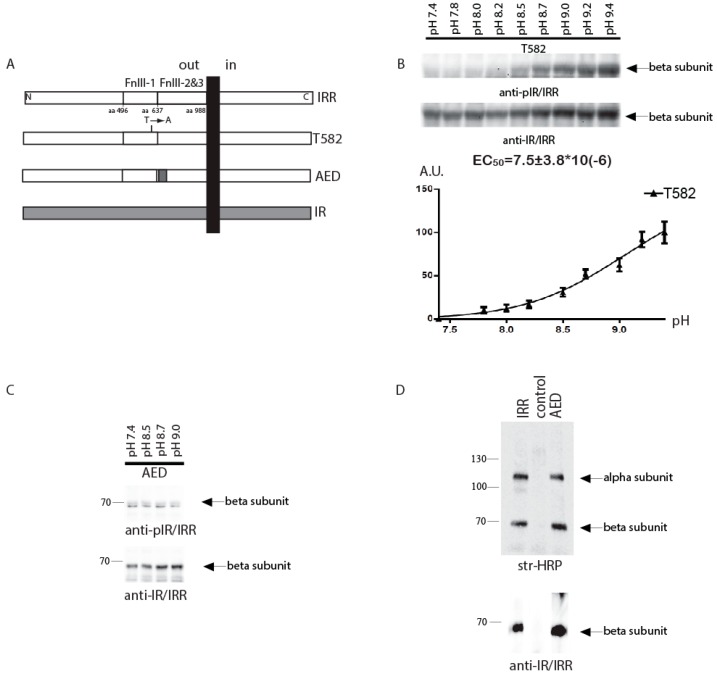
Figure 2.
The pH dependence of IRR chimeric mutants. (A) Domain models of the HA-tagged T582 and AED mutants and chimeras. (B) HEK 293 cells were transfected with indicated plasmid and incubated for 10 min with PBS medium adjusted to the indicated pH by 60 mM Tris-HCl buffer, followed by lysis and blotting with anti-pIR/IRR and anti-IR/IRR antibodies after stripping. Western blot phosphorylation signals were quantified and normalized according to the anti-IR/IRR signals. On each graph normalized signals were plotted versus pH of the tested solutions. On each plot, the Y-axis shows percentage of the maximum average value of activation at pH 9.4. The values of EC50 were calculated by GraphPad software. Values are means ± SE (n = 4). (C) The pH dependence of AED chimera phosphorylation. Pictures represented at least four independent experiments. (D) Cell surface expression of AED chimera as described in Materials and Methods.

