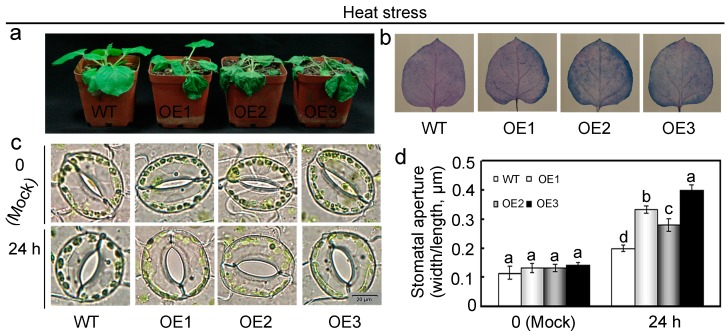
Figure 5.
Heat stress response of GhMAP3K65-overexpressing plants. (a) Photographs of WT and GhMAP3K65-overexpressing plants grown in soil under heat stress for 24 h; (b) The accumulation of dead cells was detected via Trypan blue staining; (c,d) Stomatal changes under heat stress were observed using a microscope. The experiments were repeated at least three times. The different letters above the columns indicate significant differences (p < 0.05) according to Duncan’s multiple range test.

