Figure 3.
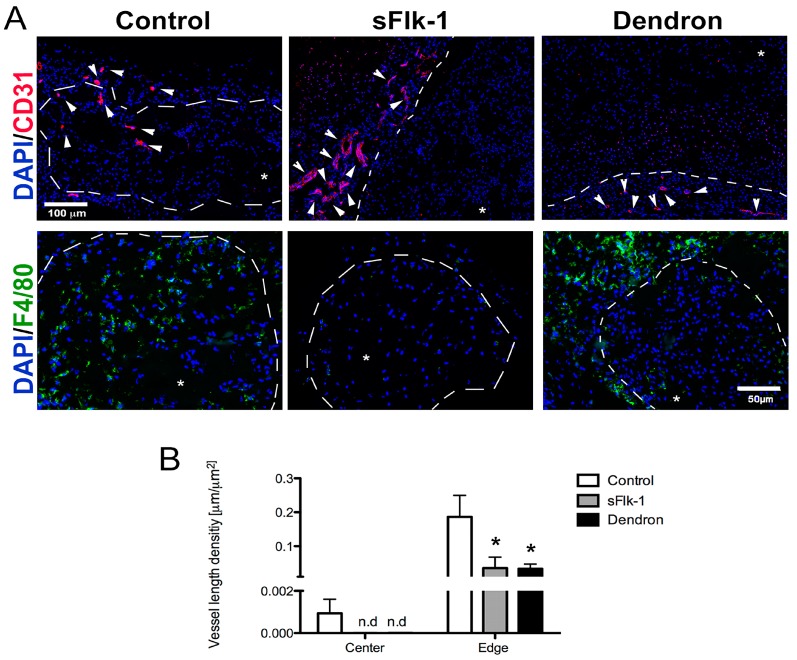
In vivo blocking of angiogenesis. (A) Representative immunofluorescence pictures of control (naïve NC), sFlk-1, and dendron-based constructs stained either in red for PECAM (CD31), an endothelial marker, (first raw, scale bar = 100 µm) or in green for F4/80, a macrophage marker (second raw, scale bar = 50 µm). Cell nuclei were stained in blue with DAPI (A). White arrows indicate the vascular structures, whereas white dotted lines mark the boundary between the implant and the surrounding host tissue. Asterisks indicate the implant area. (B) Quantification of the vessel length density in µm/µm2 at the center or edge of the implant area of naïve, sFlk-1, and dendron-based constructs (1 donor, n = 4). * p < 0.01.

