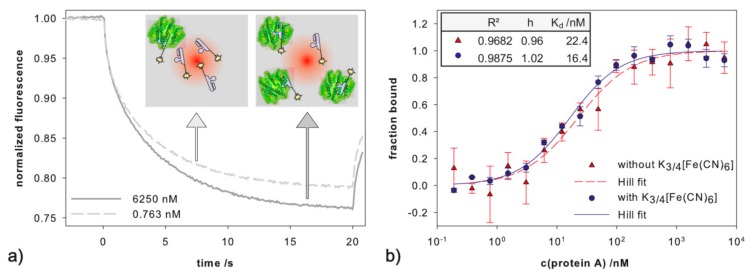
Figure 5.
(a) Microscale thermophoresis (MST) curves for a low (0.763 nM, dashed line) and a high (6250 nM, solid line) protein A concentration with 38.5 nM labeled PAA (MST power 40%, LED power 100%); (b) Binding curves of recombinant protein A with aptamer in absence (red triangles) and presence (blue circles) of 2 mM ferri-/ferrocyanide measured in triplicates—the lines represent the Hill fit.

