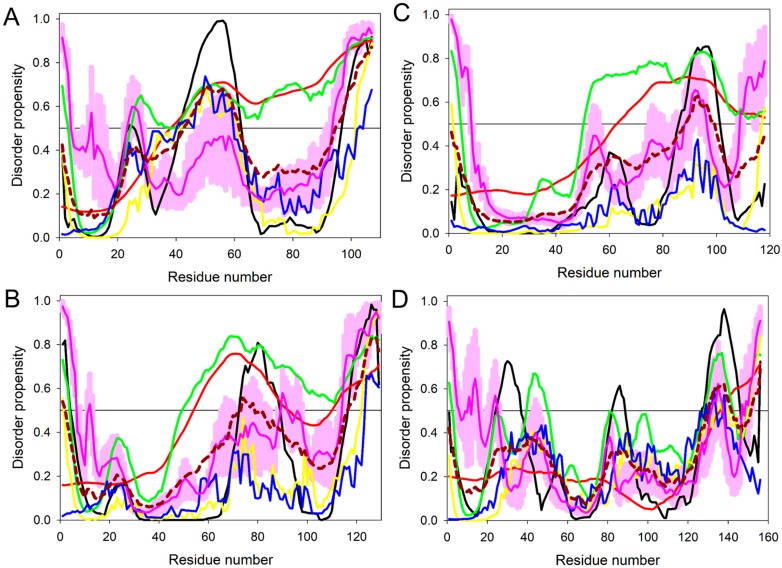
Figure 1.
Evaluating intrinsic disorder propensity of protein effectors (A) MVLG_04106; (B) MVLG_05720; (C) MVLG_06175 and (D) MVLG_01732 by a series of per-residue disorder predictors. Disorder profiles generated by PONDR® VLXT, PONDR® VL3, PONDR® VSL2, IUPred_short, IUPred_long, and PONDR® FIT, are shown by black, red, green, yellow, blue, and pink lines, respectively. Dark red dashed line shows the mean disorder propensity calculated by averaging disorder profiles of individual predictors. Light pink shadow around the PONDR® FIT shows error distribution. In these analyses, the predicted intrinsic disorder scores above 0.5 are considered to correspond to the disordered residues/regions, whereas regions with the disorder scores between 0.2 and 0.5 are considered flexible.

