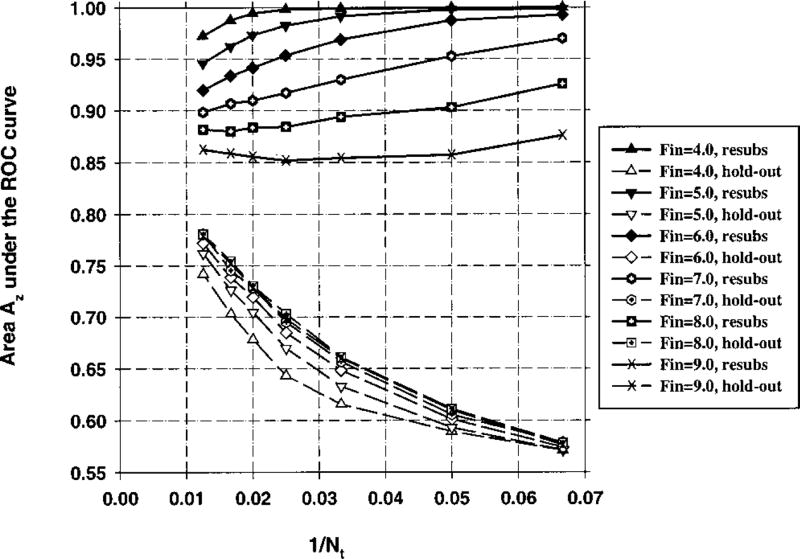
Fig. 11.
Case 1 (identity covariance matrix), Az(∞) = 0.89. Feature selection from the design samples. Total sample size Ns = 100 samples per class. The area Az under the ROC curve versus the inverse of the number of design samples Nt per class. Feature selection was performed using an input feature space of M = 200 available features.

