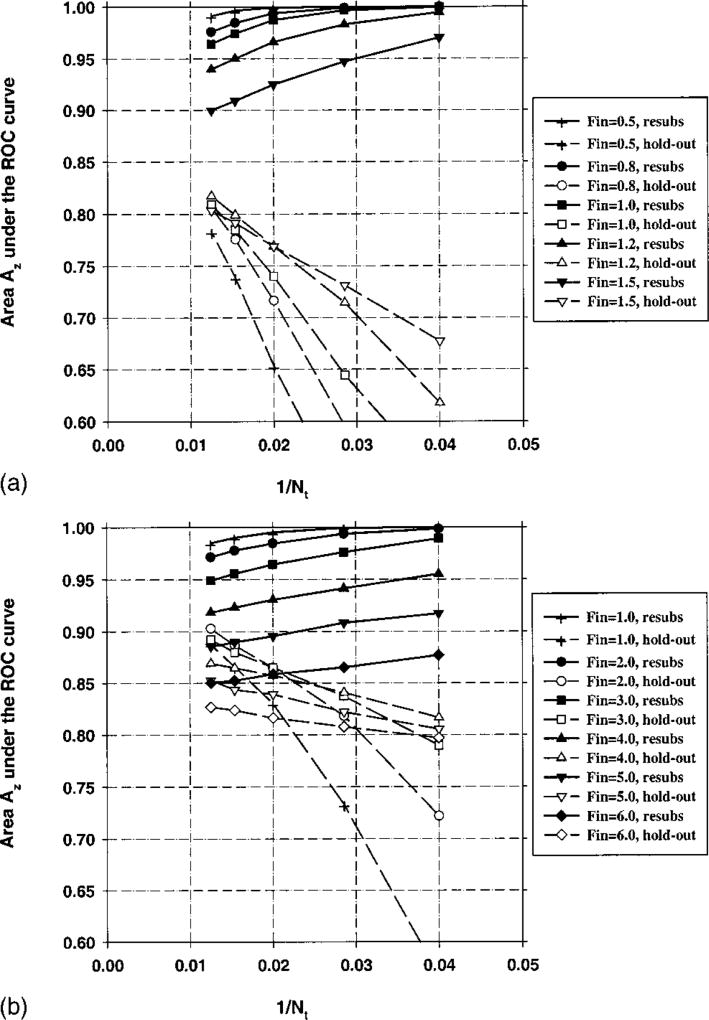
Fig. 13.
(a) Case 2(a) (correlated samples, no diagonalization), Az(∞) = 0.89. Feature selection from the entire sample space of 100 samples/class: The area Az under the ROC curve versus the inverse of the number of design samples Nt per class. Feature selection was performed using an input feature space of M = 100 available features. (b) Case 2(b) (correlated samples, and diagonalization), Az(∞) = 0.89. Feature selection from the entire sample space of 100 samples/class: The area Az under the ROC curve versus the inverse of the number of design samples Nt per class. Feature selection was performed using an input feature space of M = 100 available features.

