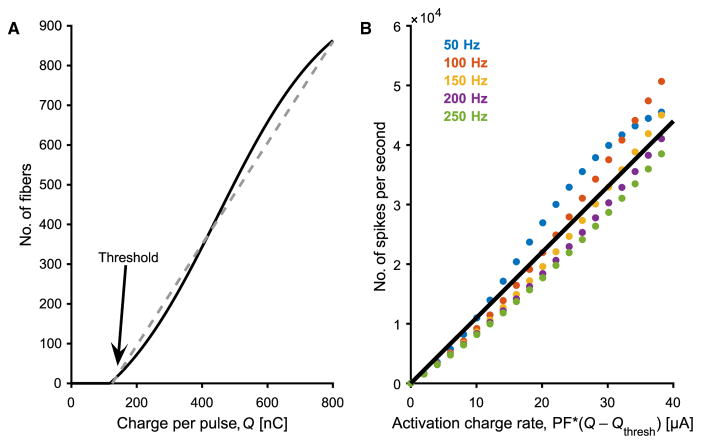
Fig. 5. Graphical representations of hypothesized neural response to stimulation intensity and spike frequency.
(A) Recruitment of nerve fibers is hypothesized to increase with increased stimulation intensity (charge per pulse). Arrow indicates the putative location of the perceptual threshold. (B) Neural population firing rate as a function of ACR. Assuming each pulse produces one spike per activated fiber, this yields an approximately linear function. Threshold is assumed to be independent of PF (see fig. S3).

