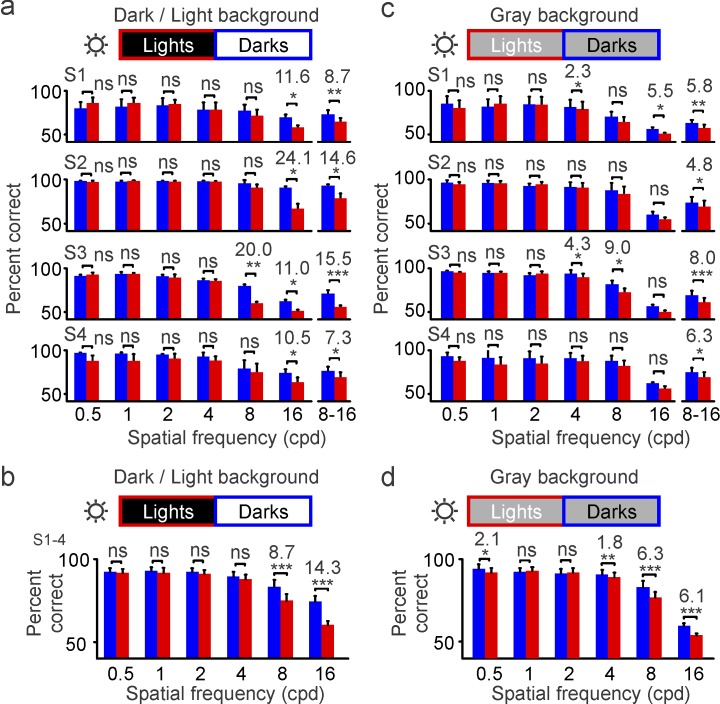
Figure 3.
Grating visual acuity is higher for darks than lights at high luminance (maximum: 312 cd/m2). Grating visual acuity measured in four different subjects (S1–S4) at high luminance (sun icon). The percentage correct is calculated as an average of four different stimulus durations (trials per spatial frequency: 1,600 for S1 and 800 for S2–S4). (a) Grating visual acuity measured with light targets on dark backgrounds (red) and dark targets on light backgrounds (blue). The bin on the right shows the percentage of correct responses for 8 and 16 c/° combined. (b) Grating visual acuity measured on dark and light backgrounds averaged across four subjects. (c–d) Same as (a–b), but for gray backgrounds. *p < 0.05, **p < 0.01, ***p < 0.001, ns: not significant. Error bars show the standard error of the mean. Notice that the percentage correct is lower in (c–d) than in (a–b) because the midgray background made the contrast lower. However, the reduction on the midgray background is less pronounced for lights than darks because the neuronal blur for lights is also reduced.

