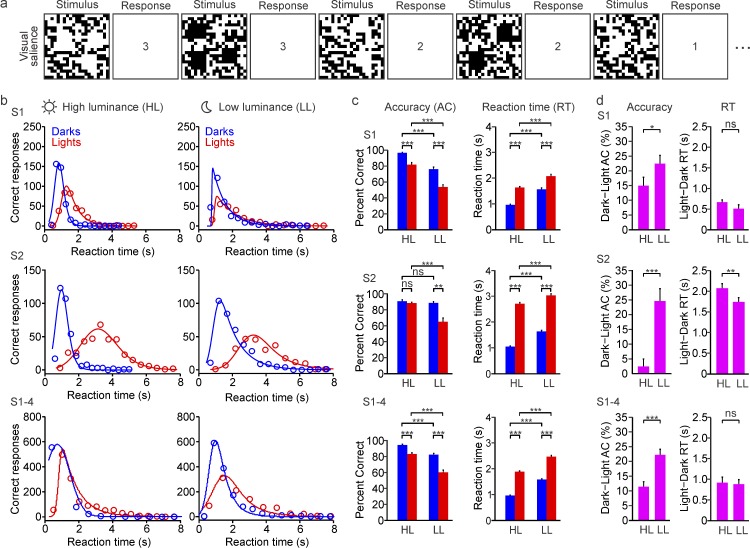
Figure 6.
Low luminance reduces visual salience more for lights than for darks. (a) Subjects were asked to report as fast as possible the number of light or dark targets (one, two, or three) presented on a uniform binary-noise background, under high-luminance (mean luminance: 156 cd/m2) and low-luminance conditions (mean luminance: 0.0156 cd/m2). The figure shows a sequence of stimulus frames and correct responses. See videos of the stimuli. (b) Relation between correct responses and reaction time for dark (blue) and light targets (red) measured under high luminance (HL, left) and low luminance (LL, right). The relations are shown for two different subjects (top: S1; middle: S2) and the average of four subjects (S1–S4). Circles: measurements. Lines: Gaussian-exponential fits. (c) Average accuracy (AC, left) and reaction time (RT, right) in the detection of darks (blue) and lights (red), measured under high luminance (HL) and low luminance (LL). The averages are shown for two individual subjects (S1 and S2) and for four subjects combined (S1–S4). (d) Average differences in accuracy (AC, left) and reaction time (RT, right) between darks and lights measured under high luminance (HL) and low luminance (LL). The averages are shown for two individual subjects (S1 and S2) and for four subjects combined (S1–S4). *p < 0.05, **p < 0.01, ***p < 0.001, ns: not significant. Error bars show the standard error of the mean.

