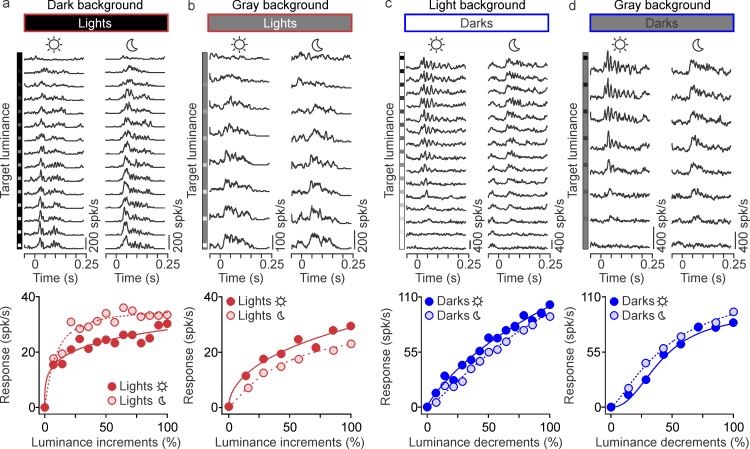
Figure 9.
The saturation of the ON luminance/response function is preserved under low light. (a) Example cortical responses to light targets presented on dark backgrounds measured under high luminance (sun icon) and low luminance (moon icon). Responses are shown as peristimulus time histograms (top) fitted with Naka–Rushton functions (bottom). (b) Same as (a), but for light targets presented on gray backgrounds. (c) Example cortical responses to dark targets presented on light backgrounds (different cortical recording site from a–b). (d) Same as (c), but for dark targets presented on gray backgrounds.

