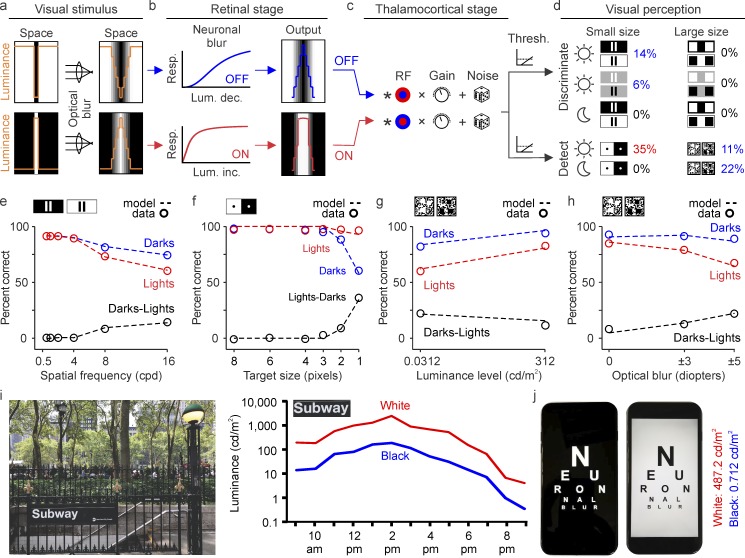
Figure 11.
All dark/light asymmetries can be explained by a model that uses greater luminance/response saturation in ON than OFF visual pathways. (A–D) The main stages of the model are a stimulus input with limited optical blur (a), a retinal stage that passes the stimulus through ON and OFF luminance/response functions with different saturation (b), a thalamocortical stage that convolves the stimulus with center–surround receptive fields of variable gain and noise level (c), and a perceptual stage that discriminates/detects the stimulus when the cortical output crosses a threshold (d). The model reproduces the higher grating resolution for closely spaced dark-bars (blue 14% and 6% on top left) and the lack of differences in resolution for large bars with wide gaps (0% on top right). It reproduces the greater visibility of small light dots (red 35%) and greater salience of dark targets on noisy backgrounds (blue 11% and 22%). (e–h) The model also reproduces changes in dark/light asymmetries measured as a function of spatial frequency (e), target size (f), luminance level (g), and optical blur (h). (i) Outdoor luminance of a black-and-white subway sign (left) measured at different times of the day (right). The luminance of black in this sign is lower than the values of midgray background used in our psychophysical experiments, while the luminance of white is frequently much higher. Therefore, neuronal blur should enlarge the letters in this subway sign throughout the entire day. (j) Indoor luminance measures from an electronic device that is commonly used to read. The luminance measures (right) indicate that neuronal blur should be very pronounced when reading on dark backgrounds in these devices. Luminance measured with Konica Minolta LS-150 (Konica Minolta Sensing Americas, Inc., Ramsey, NJ).

