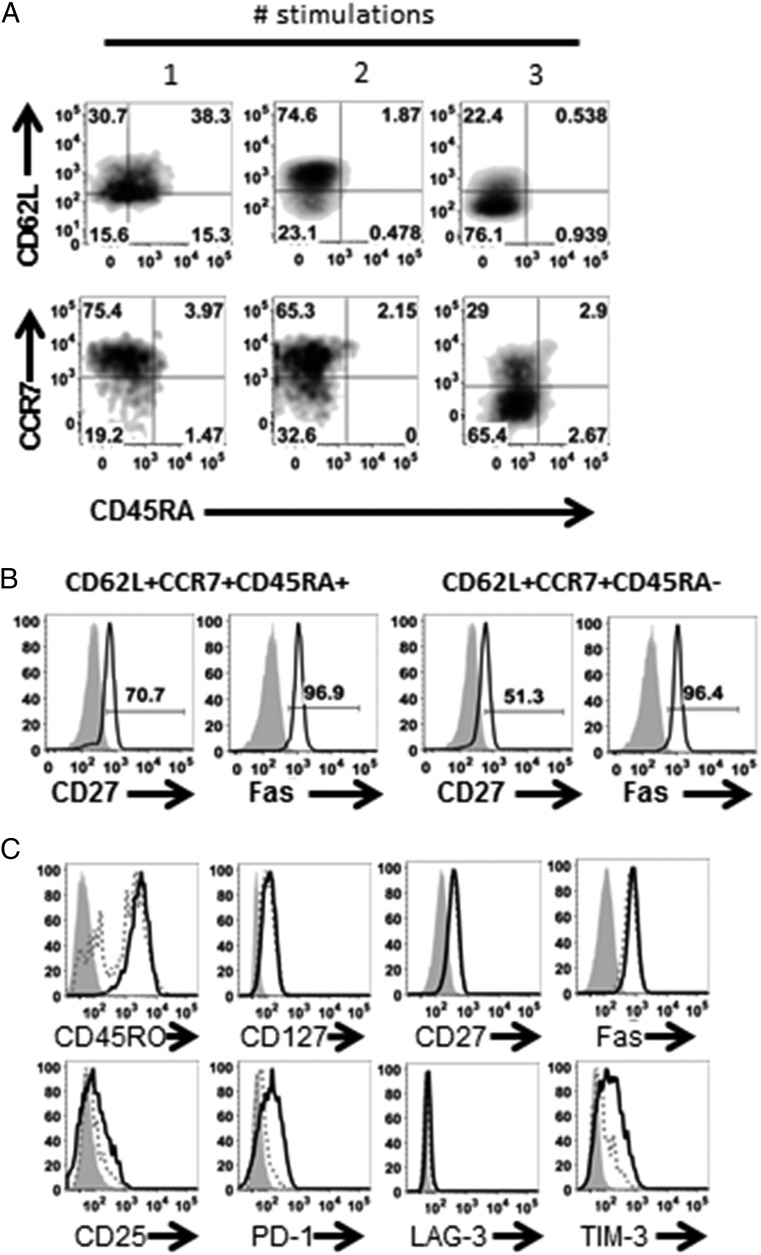
FIGURE 1.
Ag-specific CD8 T cells differentiate in response to Ag stimulation. HLA-A2+ CD8 T cells were stimulated weekly with MART1 peptide-loaded aAPC for three stimulations in total and (A) analyzed for CD62L, CCR7, and CD45RA expression following each stimulation. (B) Representative histograms of CD27 and Fas expression on CD62L+CCR7+CD45RA+ and CD62L+CCR7+CD45RA− populations (gated on tetramer+; black lines) compared with isotype (shaded gray) on the expanded MART1-specific CD8 T cell population after three stimulations. (C) Representative histograms of CD45RO, CD127, CD27, CD25, Fas, CD25, PD-1, LAG-3, and TIM-3 on MART-1 tetramer+ (black solid lines), tetramer− (dotted lines) compared with isotype (shaded gray) on the expanded MART1-specific CD8 T cell population after three stimulations. Data representative of four individual donors.

