FIGURE 2.
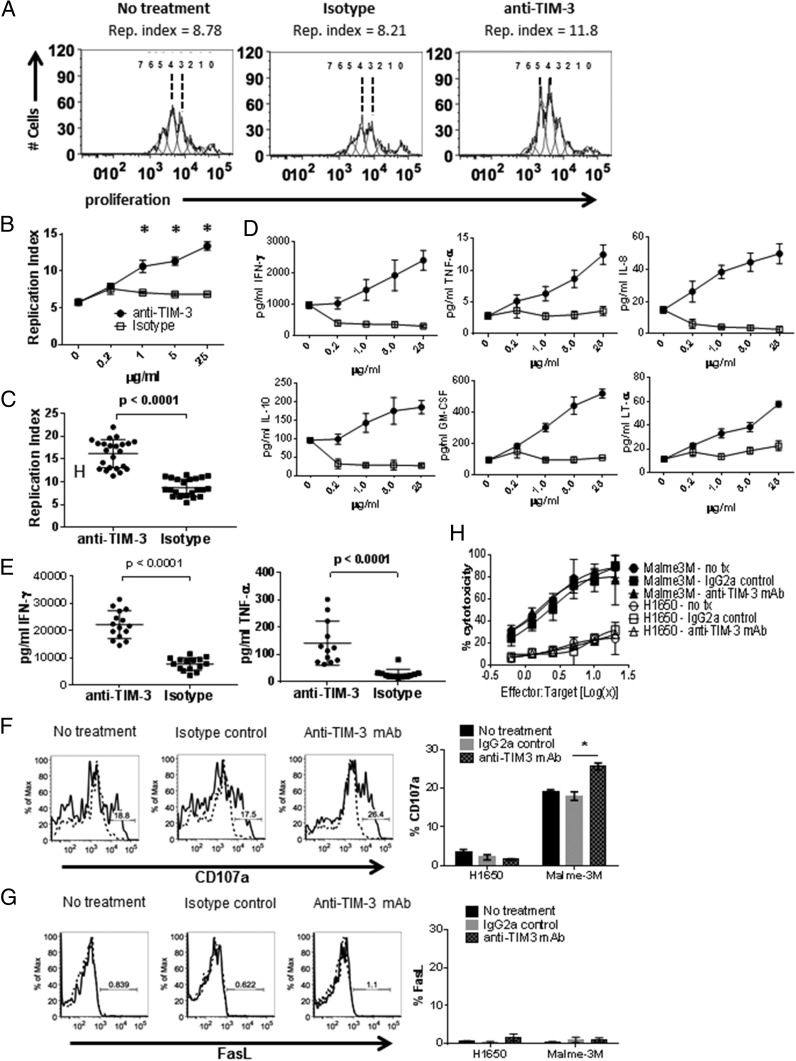
Anti–TIM-3 Ab treatment increases T cell effector function. Ag-specific CD8 T cells were cultured as in Fig. 1 with addition of anti–TIM-3 mAb, isotype control, or left untreated, and analyzed by flow cytometry for proliferation dye dilution. Representative histograms of proliferation platform of individual cell generations and calculated replication indices are shown in (A). The increase in T cell proliferation upon anti–TIM-3 Ab treatment is dose dependent (B) and is observed in T cells from multiple donors, in this study shown at 25 μg/ml anti–TIM-3 Ab concentration (C) (*p < 0.0001, paired two-tailed t test). Anti–TIM-3 impacts cytokine production in a dose-dependent manner (D) in T cells from multiple donors, in this study shown at 25 μg/ml anti–TIM-3 Ab concentration for IFN-γ and TNF-α production (E) (*p < 0.0001, paired two-tailed t test). To measure CTL activity, Ag-specific CD8+ T cells were restimulated as described in Fig. 1 in the presence of anti–TIM-3 mAb, isotype control, or left untreated. The restimulated T cells were incubated with Malme3M (MART1+) or H1650 (MART1−) tumor targets. CD107a (F) and FasL (G) cell–surface expression was measured by flow cytometry (*p < 0.001, two-way ANOVA) and target cell killing was measured by BATDA release (H). Data representative of four to six biological replicates per treatment condition performed in three independent experiments.

