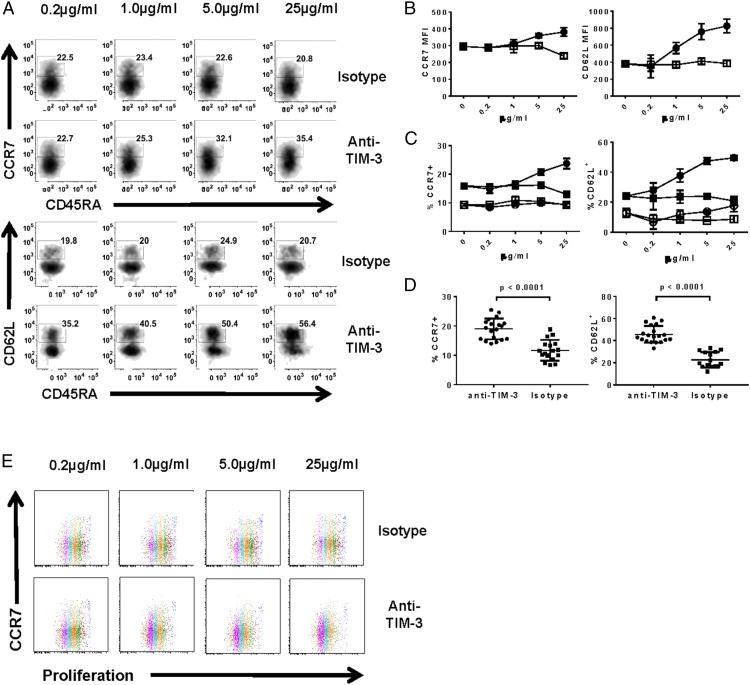
FIGURE 4.
Ag-specific CD8 T cells increase expression of CCR7 and CD62L in response to anti–TIM-3 Ab. Ag-specific CD8 T cells were cultured as in Fig. 1 in the presence of anti–TIM-3 mAb or isotype control, and analyzed by flow cytometry. (A) Representative density plots of CCR7 versus CD45RA and CD62L versus CD45RA on T cells treated with varying concentrations of anti–TIM-3 mAb/isotype control. (B) Graphical representation of CCR7 and CD62L geometric mean fluorescence intensities in response to anti–TIM-3 mAb (filled circles) or isotype control (open squares). (C) Frequency of CCR7+ and CD62L+ cells in tetramer+ (filled shapes) or tetramer− (open shapes) in response to anti–TIM-3 mAb (circles) or isotype control (squares). (D) CCR7 and CD62L expression on multiple donors when treated with 25 μg/ml anti–TIM-3 Ab (*p < 0.0001, paired two-tailed t test). (E) Representative dot plots of CCR7 versus proliferation dye dilution on T cells treated with varying concentrations of anti–TIM-3 mAb/isotype control. Cell generations are differentiated by color. Data shown are representative of four to six biological replicates per treatment condition performed in three independent experiments.

