
Figure 3(b).
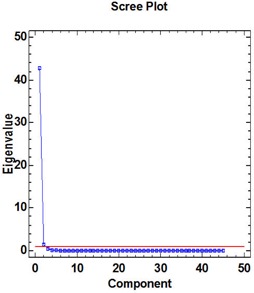
Scree plot indicating the percentage of the variation of rectum DVH described by PC1 and PC2.
Official websites use .gov
A
.gov website belongs to an official
government organization in the United States.
Secure .gov websites use HTTPS
A lock (
) or https:// means you've safely
connected to the .gov website. Share sensitive
information only on official, secure websites.
Scree plot indicating the percentage of the variation of rectum DVH described by PC1 and PC2.