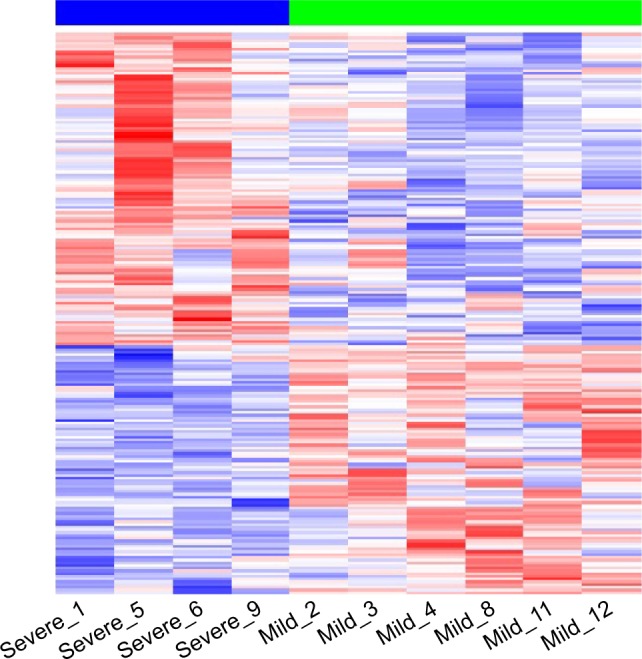
Figure 1.

Differentially expressed genes in severe (blue line) vs mild (green line) patients.
Notes: Two-dimensional hierarchical clustering of the 10 samples according to the expression of 205 genes differentially expressed (by row) comparing severe (n=4) vs mild (n=6) patients (by column), with a P-value of <0.05 and fold changes (FC) >±1.5 (logFC >±0.58) using the Limma (Linear Models for Microarray Data) method. The functional classification of genes (color-coded) is shown. Red represents a high level of gene expression while blue represents a low level of expression.
